
U.S. Silica Holdings, Inc. (SLCA): Price and Financial Metrics
SLCA Price/Volume Stats
| Current price | $15.49 | 52-week high | $16.03 |
| Prev. close | $15.50 | 52-week low | $10.09 |
| Day low | $15.48 | Volume | 1,270,860 |
| Day high | $15.50 | Avg. volume | 1,360,862 |
| 50-day MA | $15.45 | Dividend yield | N/A |
| 200-day MA | $12.86 | Market Cap | 1.21B |
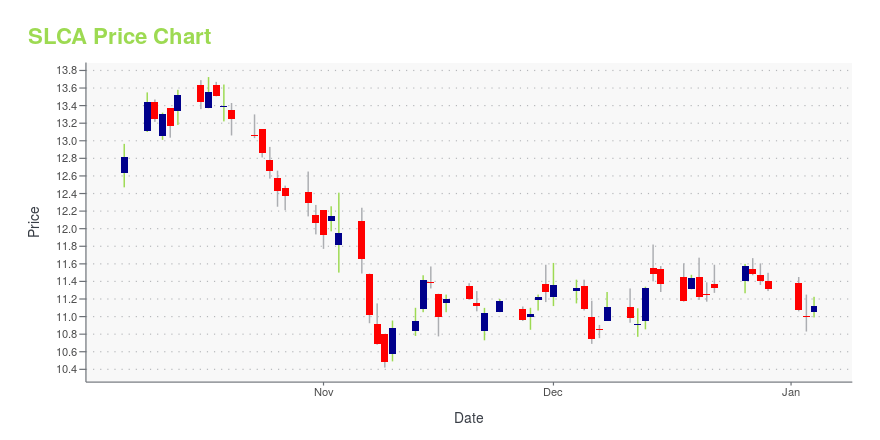
SLCA Stock Price Chart Interactive Chart >
U.S. Silica Holdings, Inc. (SLCA) Company Bio
U.S. Silica Holdings is a producer of commercial silica used in the oil and gas industry, and in a wide range of industrial applications. The company was founded in 1968 and is based in Frederick, Maryland.
Latest SLCA News From Around the Web
Below are the latest news stories about US SILICA HOLDINGS INC that investors may wish to consider to help them evaluate SLCA as an investment opportunity.
U.S. Silica Appoints Chief Accounting OfficerU.S. Silica Holdings, Inc. (NYSE: SLCA), a diversified industrial minerals company and the leading last-mile logistics provider to the oil and gas industry, today announced that it has appointed Gene Padgett as its Vice President, Chief Accounting Officer and Controller effective December 18, 2023. In this role, Mr. Padgett will report to Kevin Hough, the Company's interim Executive Vice President and Chief Financial Officer. |
U.S. Silica Holdings, Inc. (NYSE:SLCA) is a favorite amongst institutional investors who own 81%Key Insights Institutions' substantial holdings in U.S. Silica Holdings implies that they have significant influence... |
U.S. Silica Holdings, Inc. to Host Virtual Investor Event December 13U.S. Silica Holdings, Inc. (NYSE: SLCA) (the "Company"), a diversified industrial minerals company and the leading last-mile logistics provider to the oil and gas industry, today announced it will host a virtual investor event at 10:00 a.m. ET on Wednesday, December 13, 2023, to showcase its Industrial & Specialty Products (ISP) business segment. Chief Executive Officer Bryan Shinn, Executive Vice President and ISP President Zach Carusona, and members of the ISP team will provide an in-depth loo |
Investing in U.S. Silica Holdings (NYSE:SLCA) three years ago would have delivered you a 140% gainU.S. Silica Holdings, Inc. ( NYSE:SLCA ) shareholders might be concerned after seeing the share price drop 15% in the... |
Do U.S. Silica Holdings' (NYSE:SLCA) Earnings Warrant Your Attention?The excitement of investing in a company that can reverse its fortunes is a big draw for some speculators, so even... |
SLCA Price Returns
| 1-mo | 0.45% |
| 3-mo | -2.52% |
| 6-mo | 40.69% |
| 1-year | 16.55% |
| 3-year | 58.71% |
| 5-year | 52.03% |
| YTD | 36.96% |
| 2023 | -9.52% |
| 2022 | 32.98% |
| 2021 | 33.90% |
| 2020 | 15.75% |
| 2019 | -37.89% |
Continue Researching SLCA
Want to see what other sources are saying about Us Silica Holdings Inc's financials and stock price? Try the links below:Us Silica Holdings Inc (SLCA) Stock Price | Nasdaq
Us Silica Holdings Inc (SLCA) Stock Quote, History and News - Yahoo Finance
Us Silica Holdings Inc (SLCA) Stock Price and Basic Information | MarketWatch
Loading social stream, please wait...