
Skylight Health Group Inc. (SLHG): Price and Financial Metrics
SLHG Price/Volume Stats
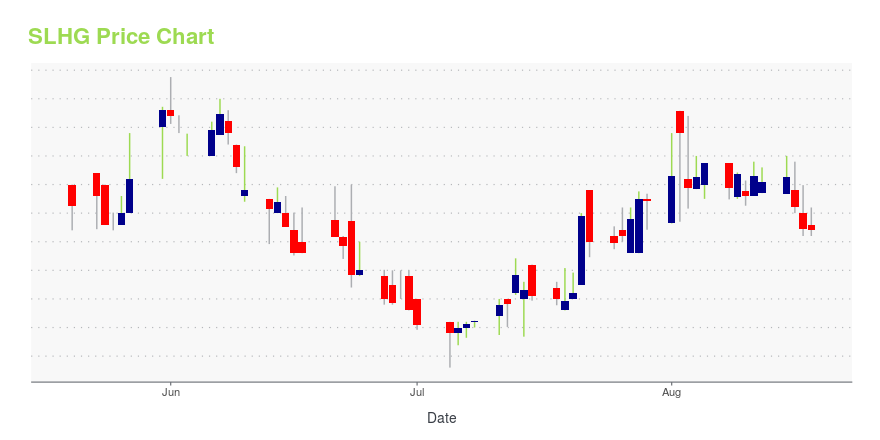
| Current price | $0.58 | 52-week high | $3.55 |
| Prev. close | $0.60 | 52-week low | $0.38 |
| Day low | $0.58 | Volume | 50,800 |
| Day high | $0.65 | Avg. volume | 94,678 |
| 50-day MA | $0.59 | Dividend yield | N/A |
| 200-day MA | $0.99 | Market Cap | 23.10M |
SLHG Stock Price Chart Interactive Chart >
Skylight Health Group Inc. (SLHG) Company Bio
Skylight Health Group, Inc. is a healthcare services and technology company that works to impact patient health outcomes. The company operates a United States health network that comprises of physical multi-disciplinary medical clinics providing a range of services from primary care, sub-specialty, allied health and laboratory & diagnostic testing. It owns and operates a proprietary electronic health record system that supports the delivery of care to patients via telemedicine and other remote monitoring system integrations. The company primarily operates an insurable fee-for-service model contracting with Medicare, Medicaid and other commercial payors. It also offers a disruptive subscription-based telemedicine service for the un & under-insured population who have limited access to urgent care due to cost. Skylight Health Group was founded by Pradyum Sekar and Kashaf Qureshi in 2014 and is headquartered in Mississauga, Canada.
Latest SLHG News From Around the Web
Below are the latest news stories about SKYLIGHT HEALTH GROUP INC that investors may wish to consider to help them evaluate SLHG as an investment opportunity.
Skylight Health Announces Closing of Convertible Debenture FinancingTORONTO, Aug. 17, 2022 (GLOBE NEWSWIRE) -- Skylight Health Group Inc. (NASDAQ:SLHG; TSXV:SLHG) (“Skylight Health” or the “Company”), a multi-state primary care management group in the United States, is pleased to announce that it has closed the non-brokered private placement announced on August 8, 2022 (the “Offering”), issuing 2,355 units of unsecured convertible debentures (“Debentures”). The principal sum of Debentures issued totals C$2,355,000. Prad Sekar, CEO & Co-Founder of Skylight Health |
Skylight Health Group Reports Second Quarter 2022 Financial Results and Upsizes FinancingRevenue Growth of 134% Year over Year, 108% Growth Compared to the Previous Quarter and Secures entry into Full-Risk Value Based Care in 2022TORONTO, Aug. 15, 2022 (GLOBE NEWSWIRE) -- Skylight Health Group Inc. (NASDAQ: SLHG; TSXV: SLHG) (“Skylight Health” or the “Company”), a multi-state primary care management group in the United States, today announced its financial results for the second quarter ended June 30, 2022. Doubles revenue to $16.1 million vs $7.7 million in the previous quarter and |
Skylight Health Announces Timing of its Second Quarter 2022 Results Conference CallTORONTO, Aug. 10, 2022 (GLOBE NEWSWIRE) -- Skylight Health Group Inc. (NASDAQ:SLHG; TSXV:SLHG) (“Skylight Health” or the “Company”), a multi-state primary care management group in the United States, is pleased to announce that its financial results for the second quarter of 2022 will be released after the close of market on August 15th, 2022. The Company will host a conference call at 8:00am EDT on the morning of August 16, 2022 to discuss the financial results and outlook for the Company. If yo |
Skylight Health Announces Non-Brokered Private Placement of Convertible Debenture UnitsTORONTO, Aug. 08, 2022 (GLOBE NEWSWIRE) -- Skylight Health Group Inc. (NASDAQ:SLHG; TSXV:SLHG) (“Skylight Health” or the “Company”), a multi-state primary care management group in the United States, has commenced a non-brokered private placement offering (the “Offering”) of convertible debenture units (the “Debenture Units”) at C$1,000 per Debenture Unit for total gross proceeds of up to C$2 million. Each Debenture shall be in the principal amount of C$1,000 and shall bear interest at the rate o |
Skylight Health Announces Series A Preferred Stock Cash DividendTORONTO, July 20, 2022 (GLOBE NEWSWIRE) -- Skylight Health Group Inc. (NASDAQ: SLHG: SLHGP; TSXV: SLHG) (“Skylight Health” or the “Company”), a multi-state primary care management group in the United States, announced that its Board of Directors has authorized, and the Company has declared, a dividend on its 9.25% Series A Cumulative Redeemable Perpetual Preferred Shares (the “Series A Preferred Shares”) for the month of August 2022. The Series A Preferred Shares trade under the “SLHGP” stock ti |
SLHG Price Returns
| 1-mo | N/A |
| 3-mo | N/A |
| 6-mo | N/A |
| 1-year | N/A |
| 3-year | -82.04% |
| 5-year | N/A |
| YTD | N/A |
| 2023 | N/A |
| 2022 | 0.00% |
| 2021 | N/A |
| 2020 | N/A |
| 2019 | N/A |
Loading social stream, please wait...