Smartsheet Inc. (SMAR): Price and Financial Metrics
GET POWR RATINGS... FREE!
SMAR POWR Grades
- SMAR scores best on the Quality dimension, with a Quality rank ahead of 60.65% of US stocks.
- The strongest trend for SMAR is in Growth, which has been heading up over the past 179 days.
- SMAR's current lowest rank is in the Value metric (where it is better than 20.73% of US stocks).
SMAR Stock Summary
- Smartsheet Inc's stock had its IPO on April 27, 2018, making it an older stock than merely 13.91% of US equities in our set.
- For SMAR, its debt to operating expenses ratio is greater than that reported by merely 15.85% of US equities we're observing.
- SMAR's price/sales ratio is 13.28; that's higher than the P/S ratio of 88.99% of US stocks.
- Stocks that are quantitatively similar to SMAR, based on their financial statements, market capitalization, and price volatility, are PING, CYBR, CSTL, NEWR, and FTK.
- Visit SMAR's SEC page to see the company's official filings. To visit the company's web site, go to www.smartsheet.com.
SMAR Valuation Summary
- SMAR's price/sales ratio is 24.4; this is 347.71% higher than that of the median Technology stock.
- Over the past 41 months, SMAR's price/earnings ratio has gone down 46.1.
- SMAR's price/sales ratio has moved up 7.1 over the prior 41 months.
Below are key valuation metrics over time for SMAR.
Stock | Date | P/S | P/B | P/E | EV/EBIT |
---|---|---|---|---|---|
SMAR | 2021-09-01 | 24.4 | 19.5 | -82.0 | -76.8 |
SMAR | 2021-08-31 | 23.9 | 19.0 | -80.1 | -75.0 |
SMAR | 2021-08-30 | 24.1 | 19.2 | -81.0 | -75.9 |
SMAR | 2021-08-27 | 23.5 | 18.7 | -78.8 | -73.7 |
SMAR | 2021-08-26 | 22.5 | 18.0 | -75.6 | -70.6 |
SMAR | 2021-08-25 | 23.1 | 18.4 | -77.7 | -72.6 |
SMAR's Quality Factors
The “Quality” component of the POWR Ratings focuses on 31 different factors of a companies fundamentals and operational strength. Here are some key insights as we drill into the specifics of these quality attributes.- SMAR has a Quality Grade of C, ranking ahead of 53.29% of graded US stocks.
- SMAR's asset turnover comes in at 0.513 -- ranking 317th of 563 Business Services stocks.
- 500 - Internal server error
The table below shows SMAR's key quality metrics over time.
Period | Asset Turnover | Gross Margin | ROIC |
---|---|---|---|
2021-07-31 | 0.513 | 0.777 | -2.441 |
2021-04-30 | 0.486 | 0.775 | -2.011 |
2021-01-31 | 0.465 | 0.778 | -1.838 |
2020-10-31 | 0.443 | 0.783 | -1.759 |
2020-07-31 | 0.416 | 0.794 | -1.432 |
2020-04-30 | 0.386 | 0.797 | -1.210 |
SMAR Stock Price Chart Interactive Chart >
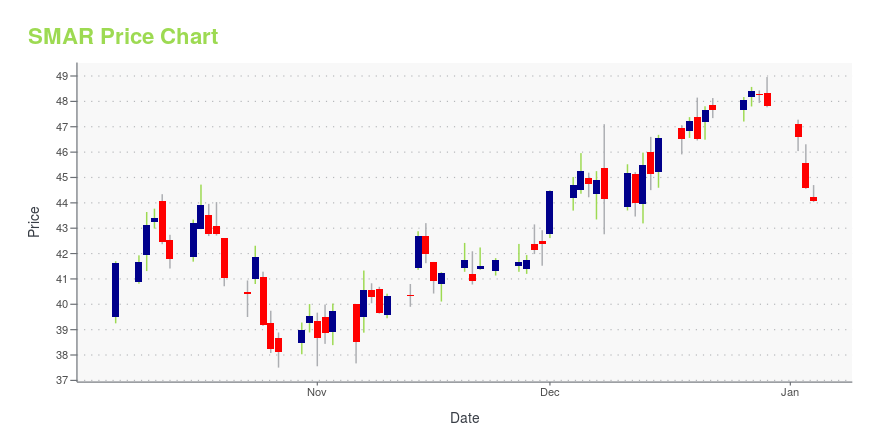
SMAR Price/Volume Stats
Current price | $32.24 | 52-week high | $85.65 |
Prev. close | $31.43 | 52-week low | $27.05 |
Day low | $30.79 | Volume | 1,095,500 |
Day high | $32.36 | Avg. volume | 1,954,600 |
50-day MA | $38.10 | Dividend yield | N/A |
200-day MA | $57.11 | Market Cap | 4.17B |
Smartsheet Inc. (SMAR) Company Bio
Smartsheet Inc. provides cloud-based platform for execution of work. It enables teams and organizations to plan, capture, manage, automate, and report on work. The company offers Smartdashboards that provides the status of work to align individuals, managers, and executives; Smartportals to easily locate and access from any device the resources available for a project without IT assistance; Smartcards to organize, share, and act on workflows; and Smartgrids to keep teams on task by easily tracking multiple moving parts. It also provides Smartprojects; Smartcalendars, which align teams and organizations by connecting deadlines to workflows; Smartforms enables business users to collect information in a structured and consistent format; Smartautomation that automates repetitive processes; and Smartintegrations enable organizations and teams to connect, sync, and extend enterprise applications. In addition, it offers Connectors; and Control Center that enables organizations to achieve consistent work execution. As of January 31, 2018, it served approximately 92,000 customers. The company was founded in 2005 and is based in Bellevue, Washington.
Latest SMAR News From Around the Web
Below are the latest news stories about Smartsheet Inc that investors may wish to consider to help them evaluate SMAR as an investment opportunity.
Five9 (FIVN) Q4 Earnings and Revenues Beat EstimatesFive9 (FIVN) delivered earnings and revenue surprises of 16.67% and 5.21%, respectively, for the quarter ended December 2021. Do the numbers hold clues to what lies ahead for the stock? |
Is it a Good Move to Acquire Some Smartsheet (SMAR) Shares?Alger, an investment management firm, published its “Alger Small Cap Focus Fund” fourth quarter 2021 investor letter – a copy of which can be downloaded here. During the fourth quarter, the largest portfolio sector weightings were Health Care and Information Technology. The largest sector overweight was Health Care. The portfolio had no exposure to the […] |
Smartsheet to Announce Fourth Quarter and Full Fiscal Year 2022 Earnings on March 15, 2022BELLEVUE, Wash.--(BUSINESS WIRE)--Smartsheet Inc. (NYSE: SMAR), the enterprise platform for dynamic work, today announced that it will release its financial results for its fourth quarter and full fiscal year 2022, which ended January 31, 2022, after the close of U.S. financial markets on March 15, 2022. Smartsheet executives will host a conference call and webcast that day at 4:30 p.m. ET (1:30 p.m. PT) to discuss the results. The dial-in number to access the call will be (888) 440-6385 or (64 |
Glynn Capital Management Llc Buys Nu Holdings, Olo Inc, Okta Inc, Sells Atlassian Corporation ...Menlo Park, CA, based Investment company Glynn Capital Management Llc (Current Portfolio) buys Nu Holdings, Olo Inc, Okta Inc, Block Inc, Sea, sells Atlassian Corporation PLC, Coupa Software Inc, CrowdStrike Holdings Inc, Veeva Systems Inc, Smartsheet Inc during the 3-months ended 2021Q4, according to the most recent filings of the investment company, Glynn Capital Management Llc. |
Why a Co-Founder of Facebook Is Buying Millions of Shares of AsanaA powerful billionaire is buying millions of ASAN stock shares right now. |
SMAR Price Returns
1-mo | -15.31% |
3-mo | -41.92% |
6-mo | -52.73% |
1-year | -56.12% |
3-year | -37.40% |
5-year | N/A |
YTD | -58.37% |
2021 | 11.78% |
2020 | 54.25% |
2019 | 80.69% |
2018 | N/A |
2017 | N/A |
Continue Researching SMAR
Want to see what other sources are saying about Smartsheet Inc's financials and stock price? Try the links below:Smartsheet Inc (SMAR) Stock Price | Nasdaq
Smartsheet Inc (SMAR) Stock Quote, History and News - Yahoo Finance
Smartsheet Inc (SMAR) Stock Price and Basic Information | MarketWatch
Loading social stream, please wait...