Splunk Inc. (SPLK): Price and Financial Metrics
GET POWR RATINGS... FREE!
SPLK POWR Grades
- SPLK scores best on the Growth dimension, with a Growth rank ahead of 95.91% of US stocks.
- SPLK's strongest trending metric is Growth; it's been moving up over the last 177 days.
- SPLK ranks lowest in Stability; there it ranks in the 16th percentile.
SPLK Stock Summary
- The capital turnover (annual revenue relative to shareholder's equity) for SPLK is -5.8 -- better than merely 2.64% of US stocks.
- Price to trailing twelve month operating cash flow for SPLK is currently 55.47, higher than 91.57% of US stocks with positive operating cash flow.
- SPLK's equity multiplier -- a measure of assets relative to shareholders'equity -- is greater than that of only 1.81% of US stocks.
- Stocks that are quantitatively similar to SPLK, based on their financial statements, market capitalization, and price volatility, are RPD, TWLO, DOMO, S, and MODN.
- SPLK's SEC filings can be seen here. And to visit SPLUNK INC's official web site, go to www.splunk.com.
SPLK Valuation Summary
- In comparison to the median Technology stock, SPLK's price/sales ratio is 67.86% higher, now standing at 4.7.
- Over the past 131 months, SPLK's price/earnings ratio has gone up 275.9.
Below are key valuation metrics over time for SPLK.
Stock | Date | P/S | P/B | P/E | EV/EBIT |
---|---|---|---|---|---|
SPLK | 2023-01-31 | 4.7 | -27.5 | -22.8 | -32.8 |
SPLK | 2023-01-30 | 4.6 | -26.9 | -22.3 | -32.2 |
SPLK | 2023-01-27 | 4.7 | -27.4 | -22.7 | -32.7 |
SPLK | 2023-01-26 | 4.7 | -27.5 | -22.8 | -32.8 |
SPLK | 2023-01-25 | 4.6 | -26.5 | -22.0 | -31.8 |
SPLK | 2023-01-24 | 4.6 | -26.5 | -22.0 | -31.8 |
SPLK Growth Metrics
- Its 4 year price growth rate is now at 203.74%.
- Its 2 year cash and equivalents growth rate is now at -11.76%.
- The 5 year price growth rate now stands at 203.74%.

The table below shows SPLK's growth in key financial areas (numbers in millions of US dollars).
Date | Revenue | Operating Cash Flow | Net Income to Common Stock |
---|---|---|---|
2022-09-30 | 3,303.722 | 306.331 | -687.477 |
2022-06-30 | 3,038.704 | 238.027 | -998.179 |
2022-03-31 | 2,845.694 | 200.735 | -1,172.418 |
2021-12-31 | 2,673.664 | 128.048 | -1,339.097 |
2021-09-30 | 2,517.623 | -28.407 | -1,337.822 |
2021-06-30 | 2,411.444 | -52.09 | -1,196.031 |
SPLK's Quality Factors
The “Quality” component of the POWR Ratings focuses on 31 different factors of a companies fundamentals and operational strength. Here are some key insights as we drill into the specifics of these quality attributes.- SPLK has a Quality Grade of C, ranking ahead of 50.26% of graded US stocks.
- SPLK's asset turnover comes in at 0.423 -- ranking 360th of 563 Business Services stocks.
- BNFT, QNST, and AINC are the stocks whose asset turnover ratios are most correlated with SPLK.
The table below shows SPLK's key quality metrics over time.
Period | Asset Turnover | Gross Margin | ROIC |
---|---|---|---|
2021-07-31 | 0.423 | 0.734 | -0.288 |
2021-04-30 | 0.410 | 0.743 | -0.255 |
2021-01-31 | 0.399 | 0.754 | -0.204 |
2020-10-31 | 0.416 | 0.769 | -0.177 |
2020-07-31 | 0.438 | 0.788 | -0.146 |
2020-04-30 | 0.468 | 0.805 | -0.111 |
SPLK Price Target
For more insight on analysts targets of SPLK, see our SPLK price target page. And for a list of of all stocks sorted by upside potential based on analyst target price, see our Top Price Target page.
Average Price Target | $178.50 | Average Broker Recommendation | 1.59 (Moderate Buy) |
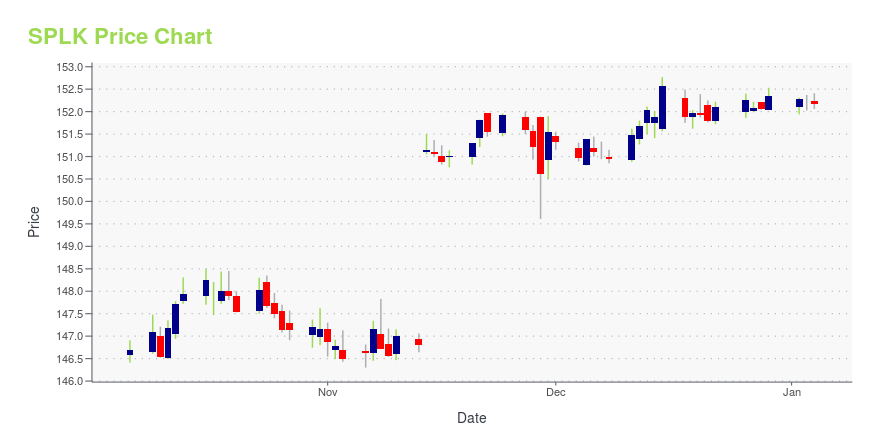
SPLK Stock Price Chart Interactive Chart >
SPLK Price/Volume Stats
Current price | $103.81 | 52-week high | $150.79 |
Prev. close | $104.57 | 52-week low | $65.00 |
Day low | $103.08 | Volume | 1,610,800 |
Day high | $106.57 | Avg. volume | 1,799,008 |
50-day MA | $88.41 | Dividend yield | N/A |
200-day MA | $93.03 | Market Cap | 16.99B |
Splunk Inc. (SPLK) Company Bio
Splunk Inc. is an American software company based in San Francisco, California, that produces software for searching, monitoring, and analyzing machine-generated data via a Web-style interface. (Source:Wikipedia)
Latest SPLK News From Around the Web
Below are the latest news stories about SPLUNK INC that investors may wish to consider to help them evaluate SPLK as an investment opportunity.
Buy Splunk Stock, Not Datadog, as Cloud Growth Slows, One Analyst SaysKeyBanc analyst Michael Turits sees slower growth ahead for enterprise software spending. Here's how he would play it. |
Splunk to Announce Fiscal 2023 Fourth Quarter and Full Year Results on March 1, 2023SAN FRANCISCO, February 03, 2023--Splunk Inc. (NASDAQ: SPLK), the data platform leader for security and observability, will report results for its fourth quarter and full year ended January 31, 2023 on Wednesday, March 1, 2023. Results will be included in a press release with accompanying financial information that will be released after market close and posted on the Splunk Investor Relations website. |
3 AI Stocks to Buy as Biden Doubles Down on Artificial IntelligenceThe White House has announced a new AI partnership with the EU. |
Splunk Layoffs 2023: What to Know About the Latest SPLK Job CutsThe AI market is booming but many tech companies are resorting to job cuts. |
Splunk to Cut About 325 Jobs, Scale Back OutsourcingThe software company also said it would scale back the use of external agencies and consultants as it seeks to cut costs. |
SPLK Price Returns
1-mo | 24.53% |
3-mo | 44.40% |
6-mo | -6.80% |
1-year | -11.86% |
3-year | -36.14% |
5-year | 20.79% |
YTD | 20.58% |
2022 | -25.60% |
2021 | -31.89% |
2020 | 13.43% |
2019 | 42.84% |
2018 | 26.57% |
Continue Researching SPLK
Want to do more research on Splunk Inc's stock and its price? Try the links below:Splunk Inc (SPLK) Stock Price | Nasdaq
Splunk Inc (SPLK) Stock Quote, History and News - Yahoo Finance
Splunk Inc (SPLK) Stock Price and Basic Information | MarketWatch
Loading social stream, please wait...