
System1, Inc. (SST): Price and Financial Metrics
SST Price/Volume Stats
| Current price | $1.38 | 52-week high | $3.36 |
| Prev. close | $1.38 | 52-week low | $1.04 |
| Day low | $1.33 | Volume | 52,588 |
| Day high | $1.39 | Avg. volume | 315,234 |
| 50-day MA | $1.44 | Dividend yield | N/A |
| 200-day MA | $1.62 | Market Cap | 124.35M |
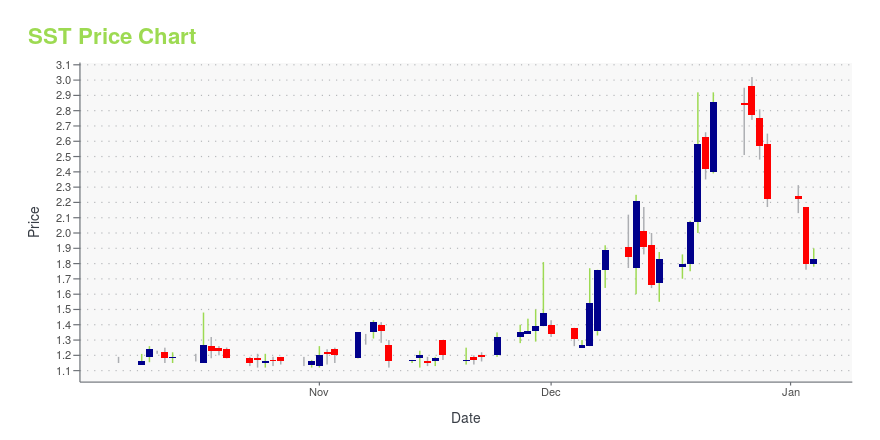
SST Stock Price Chart Interactive Chart >
System1, Inc. (SST) Company Bio
System1, Inc. develops technology and data science to operate responsive acquisition marketing platform. It serves customers in the areas of health and wellness, automotive, personal finance, travel, and entertainment. The company was founded in 2013 and is headquartered in Los Angeles, California.
Latest SST News From Around the Web
Below are the latest news stories about SYSTEM1 INC that investors may wish to consider to help them evaluate SST as an investment opportunity.
System1 to Participate in the 2024 ICR ConferenceLOS ANGELES, December 18, 2023--System1, Inc. (NYSE: SST) ("System1" or the "Company"), an omnichannel customer acquisition marketing platform, announced today that management will participate in the 2024 ICR Conference on January 8-10, 2024 at the Grande Lakes Resort in Orlando, FL. |
System1 to Report Third Quarter 2023 Financial ResultsLOS ANGELES, December 04, 2023--System1, Inc. (NYSE: SST) ("System1" or the "Company"), an omnichannel customer acquisition marketing platform, announced today that it will report financial results for the third quarter ended September 30, 2023 on Tuesday, December 12, 2023 after the U.S. stock market closes. |
System1 to Participate in The Benchmark Company’s Discovery One-on-One Investor ConferenceLOS ANGELES, December 01, 2023--System1, Inc. (NYSE: SST) ("System1" or the "Company"), an omnichannel customer acquisition marketing platform, announced today that management will participate in The Benchmark Company’s 12th Annual Discovery One-on-One Investor Conference to be held Thursday, December 7, 2023 at the New York Athletic Club in New York, NY. |
System1 Announces Sale of Total SecurityLOS ANGELES, November 30, 2023--System1, Inc. (NYSE: SST) ("System1" or the "Company"), an omnichannel customer acquisition marketing platform, today announced the sale of Total Security Limited ("Total Security") to a group led by Just Develop It Limited (the "Transaction"). |
System1’s RoadWarrior App Introduces New Proof of Delivery for Packages, Launches New Marketplace for Subscription Add-OnsLOS ANGELES, November 21, 2023--System1, Inc. (NYSE: SST), an omnichannel customer acquisition marketing platform, announced today that its RoadWarrior app, a MapQuest acquisition that optimizes complex delivery routes to save time and fuel for drivers, has introduced a Proof of Delivery feature in connection with its launch of a new marketplace for feature-specific subscription add-ons. |
SST Price Returns
| 1-mo | 0.00% |
| 3-mo | -20.23% |
| 6-mo | -30.30% |
| 1-year | -52.41% |
| 3-year | -86.06% |
| 5-year | N/A |
| YTD | -37.84% |
| 2023 | -52.67% |
| 2022 | -52.91% |
| 2021 | -7.69% |
| 2020 | N/A |
| 2019 | N/A |
Loading social stream, please wait...