
Sterling Construction Company Inc (STRL): Price and Financial Metrics
STRL Price/Volume Stats
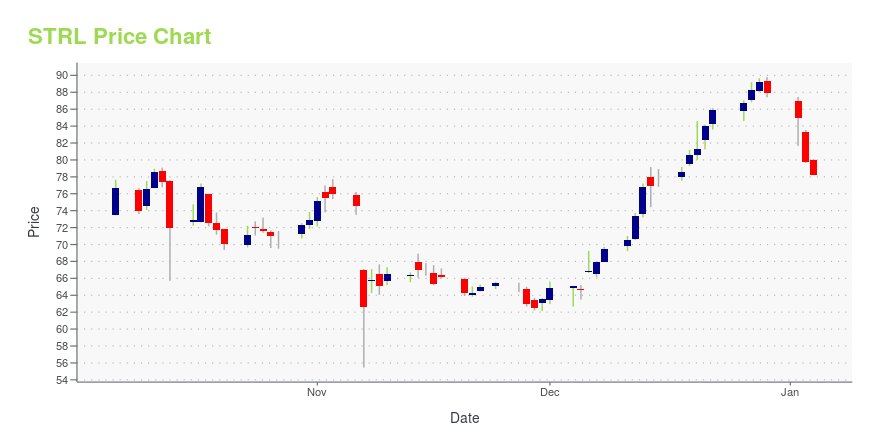
| Current price | $115.28 | 52-week high | $137.63 |
| Prev. close | $110.06 | 52-week low | $55.45 |
| Day low | $113.40 | Volume | 196,649 |
| Day high | $116.28 | Avg. volume | 364,583 |
| 50-day MA | $119.42 | Dividend yield | N/A |
| 200-day MA | $95.29 | Market Cap | 3.56B |
STRL Stock Price Chart Interactive Chart >
Sterling Construction Company Inc (STRL) Company Bio
Sterling Construction Company, Inc. operates as a heavy civil construction company in Texas, Utah, Nevada, Colorado, Arizona, California, Hawaii, and other states in the United States. The company builds, repairs, and reconstructs transportation infrastructure projects, including highways, roads, bridges, airfields, ports, and light rail; and water infrastructure projects comprising water, wastewater, and storm drainage systems. The company was founded in 1955 and is based in The Woodlands, Texas.
Latest STRL News From Around the Web
Below are the latest news stories about STERLING INFRASTRUCTURE INC that investors may wish to consider to help them evaluate STRL as an investment opportunity.
Sterling Announces Extension of Credit FacilitySterling Infrastructure, Inc. (NasdaqGS: STRL) ("Sterling" or "the Company") today announced that it requested and received an amendment to its 2019 credit agreement that extends the maturity of the credit facility by 18-months to April of 2026. |
Bull of the Day: FluorWhen it comes to companies that may be in store for a boost from President Biden’s $1.2 trillion infrastructure bill, Fluor Corporation will be one to watch |
Sterling Announces Authorization of a $200 Million Stock Repurchase ProgramSterling Infrastructure, Inc. (NasdaqGS: STRL) ("Sterling" or "the Company") today announced that its Board of Directors has authorized a program to repurchase shares of Sterling's outstanding common stock. Under the program, Sterling may repurchase up to $200 million of its outstanding common stock over the next 24 months. The timing and amount of any share repurchases will be at the discretion of management and will depend on a variety of factors. Share repurchases under the program may be mad |
20 Most Congested Highways in AmericaIn this article, we will be navigating through the US roadway system while covering the 20 most congested highways in America. If you wish to skip our detailed analysis, you can move directly to the 5 Most Congested Highways in America. Mobility Across the US The United States is well connected through an established road […] |
Next Level Gains: 3 Under-The-Radar Stocks With 10X Potential by 2026Are you looking for next level gains with under the radar stocks? |
STRL Price Returns
| 1-mo | -2.43% |
| 3-mo | 8.87% |
| 6-mo | 53.44% |
| 1-year | 96.22% |
| 3-year | 446.35% |
| 5-year | 811.30% |
| YTD | 31.10% |
| 2023 | 168.08% |
| 2022 | 24.71% |
| 2021 | 41.32% |
| 2020 | 32.17% |
| 2019 | 29.29% |
Continue Researching STRL
Here are a few links from around the web to help you further your research on Sterling Construction Co Inc's stock as an investment opportunity:Sterling Construction Co Inc (STRL) Stock Price | Nasdaq
Sterling Construction Co Inc (STRL) Stock Quote, History and News - Yahoo Finance
Sterling Construction Co Inc (STRL) Stock Price and Basic Information | MarketWatch
Loading social stream, please wait...