
Silvercorp Metals Inc. Common Shares (SVM): Price and Financial Metrics
SVM Price/Volume Stats
| Current price | $3.68 | 52-week high | $4.39 |
| Prev. close | $3.67 | 52-week low | $2.08 |
| Day low | $3.65 | Volume | 819,212 |
| Day high | $3.78 | Avg. volume | 1,709,059 |
| 50-day MA | $3.69 | Dividend yield | 0.67% |
| 200-day MA | $2.97 | Market Cap | 653.84M |
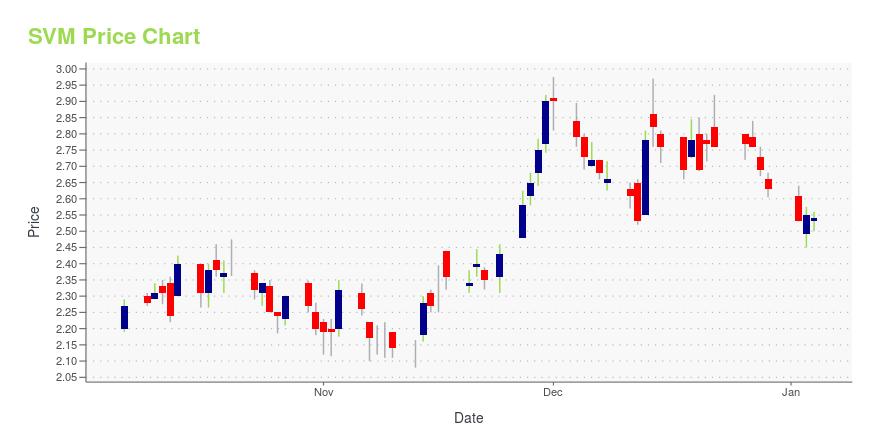
SVM Stock Price Chart Interactive Chart >
Silvercorp Metals Inc. Common Shares (SVM) Company Bio
Silvercorp Metals Inc. is a silver-producing Canadian mining company. The Company is engaged in the acquisition, exploration, development, and mining of silver-related mineral properties in China.
Latest SVM News From Around the Web
Below are the latest news stories about SILVERCORP METALS INC that investors may wish to consider to help them evaluate SVM as an investment opportunity.
Silvercorp Adds New General Manager for Tanzania ProjectSilvercorp Metals Inc. ("Silvercorp" or the "Company") (TSX: SVM) (NYSE American: SVM) is pleased to announce the hiring of Mr. Kevin Moxham as General Manager of Tanzania Projects effective January 1, 2024. |
Silvercorp Announces Takeover Offer for OreCorpSilvercorp Metals Inc. ("Silvercorp" or the "Company") (TSX: SVM) (NYSE American: SVM) and OreCorp Limited ("OreCorp") (ASX: ORR) have entered into a Bid Implementation Deed ("BID"), pursuant to which Silvercorp has agreed to acquire, by means of an off-market takeover offer, all of the OreCorp Shares not already owned by Silvercorp for consideration comprising 0.0967 common shares of Silvercorp ("Silvercorp Shares") and A$0.19 cash per OreCorp Share (the "Consideration"), currently equivalent t |
SILVERCORP REPORTS HIGH-GRADE GOLD-SILVER-LEAD-ZINC DRILL RESULTS FROM THE HPG MINESilvercorp Metals Inc. ("Silvercorp" or the "Company") (TSX: SVM) (NYSE American: SVM) is pleased to report high-grade gold-silver-lead-zinc intercepts from its ongoing diamond drilling program at the HPG mine in the Ying Mining District, China. |
Silvercorp Considering Perseus AnnouncementsSilvercorp Metals Inc. ("Silvercorp" or the "Company") (TSX: SVM) (NYSE American: SVM) notes the announcements made by Perseus Mining Limited ("Perseus") (ASX: PRU) (TSX: PRU) in relation to its acquisition of a 19.9% interest in OreCorp Limited ("OreCorp") (ASX: ORR). Silvercorp is considering these announcements to determine an appropriate course of action in the best interests of Silvercorp shareholders. |
Silvercorp and OreCorp Enter into Amending AgreementSilvercorp Metals Inc. ("Silvercorp" or the "Company") (TSX: SVM) (NYSE American: SVM) announces that it has entered into an amendment (the "Amending Deed") to the binding scheme implementation deed dated August 5, 2023 (the "Agreement") entered into previously with OreCorp Limited (ASX: ORR) ("OreCorp"), whereby Silvercorp agreed to acquire all fully-paid ordinary shares of OreCorp (the "Transaction") not held by Silvercorp or its associates (the "OreCorp Shares"), pursuant to an Australian sch |
SVM Price Returns
| 1-mo | 9.52% |
| 3-mo | 11.56% |
| 6-mo | 54.50% |
| 1-year | 26.28% |
| 3-year | -21.56% |
| 5-year | 20.73% |
| YTD | 40.40% |
| 2023 | -10.30% |
| 2022 | -20.57% |
| 2021 | -43.51% |
| 2020 | 18.73% |
| 2019 | 172.35% |
SVM Dividends
| Ex-Dividend Date | Type | Payout Amount | Change | ||||||
|---|---|---|---|---|---|---|---|---|---|
| Loading, please wait... | |||||||||
Continue Researching SVM
Here are a few links from around the web to help you further your research on Silvercorp Metals Inc's stock as an investment opportunity:Silvercorp Metals Inc (SVM) Stock Price | Nasdaq
Silvercorp Metals Inc (SVM) Stock Quote, History and News - Yahoo Finance
Silvercorp Metals Inc (SVM) Stock Price and Basic Information | MarketWatch
Loading social stream, please wait...