Tantech Holdings Ltd. (TANH): Price and Financial Metrics
GET POWR RATINGS... FREE!
TANH Stock Summary
- TANH has a higher market value than only 0.05% of US stocks; more precisely, its current market capitalization is $2,143,705.
- TANH's one year PEG ratio, measuring expected growth in earnings next year relative to current common stock price is 0.02 -- higher than just 0.26% of US-listed equities with positive expected earnings growth.
- With a price/sales ratio of 0.05, Tantech Holdings Ltd has a higher such ratio than merely 0.28% of stocks in our set.
- Stocks that are quantitatively similar to TANH, based on their financial statements, market capitalization, and price volatility, are XPER, MRCY, SWIR, ONTO, and PRGS.
- Visit TANH's SEC page to see the company's official filings. To visit the company's web site, go to www.tantech.cn.
TANH Valuation Summary
- In comparison to the median Consumer Defensive stock, TANH's price/earnings ratio is 120.31% lower, now standing at -4.6.
- TANH's price/sales ratio has moved down 1.9 over the prior 78 months.
- Over the past 78 months, TANH's price/earnings ratio has gone down 21.3.
Below are key valuation metrics over time for TANH.
Stock | Date | P/S | P/B | P/E | EV/EBIT |
---|---|---|---|---|---|
TANH | 2021-09-03 | 0.7 | 0.3 | -4.6 | 0.0 |
TANH | 2021-09-02 | 0.7 | 0.3 | -4.7 | -0.1 |
TANH | 2021-09-01 | 0.7 | 0.3 | -4.8 | -0.2 |
TANH | 2021-08-31 | 0.7 | 0.3 | -4.8 | -0.2 |
TANH | 2021-08-30 | 0.7 | 0.3 | -4.7 | -0.1 |
TANH | 2021-08-27 | 0.7 | 0.3 | -4.7 | -0.1 |
TANH Growth Metrics
- The 4 year revenue growth rate now stands at -0.11%.
- Its 5 year price growth rate is now at 11.16%.
- Its 3 year net cashflow from operations growth rate is now at 140.71%.

The table below shows TANH's growth in key financial areas (numbers in millions of US dollars).
Date | Revenue | Operating Cash Flow | Net Income to Common Stock |
---|---|---|---|
2021-06-30 | 40.02707 | 10.07512 | -14.31531 |
2020-12-31 | 42.28367 | 14.17156 | -6.52042 |
2020-06-30 | 51.16978 | 5.771788 | -5.797683 |
2019-12-31 | 49.23057 | 14.69691 | -6.356967 |
2019-06-30 | 34.52576 | 3.052075 | 0.648569 |
2018-12-31 | 29.5614 | 14.66488 | 1.976767 |
TANH's Quality Factors
The “Quality” component of the POWR Ratings focuses on 31 different factors of a companies fundamentals and operational strength. Here are some key insights as we drill into the specifics of these quality attributes.- TANH has a Quality Grade of D, ranking ahead of 13.26% of graded US stocks.
- TANH's asset turnover comes in at 0.365 -- ranking 70th of 90 Chemicals stocks.
- AVD, NGVT, and CC are the stocks whose asset turnover ratios are most correlated with TANH.
The table below shows TANH's key quality metrics over time.
Period | Asset Turnover | Gross Margin | ROIC |
---|---|---|---|
2020-12-31 | 0.365 | 0.106 | -0.093 |
2020-06-30 | 0.427 | 0.089 | -0.064 |
2019-12-31 | 0.394 | 0.121 | -0.067 |
2019-06-30 | 0.269 | 0.286 | 0.030 |
2018-12-31 | 0.217 | 0.272 | 0.042 |
2018-06-30 | 0.407 | 0.242 | 0.096 |
TANH Stock Price Chart Interactive Chart >
TANH Price/Volume Stats
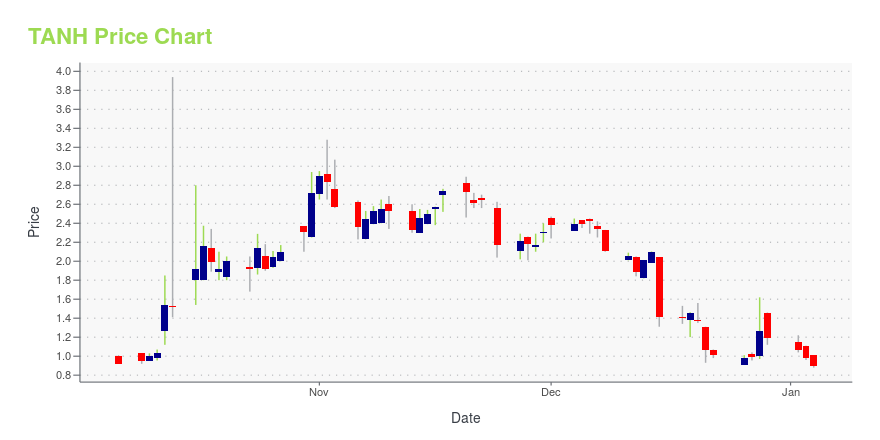
Current price | $0.31 | 52-week high | $15.70 |
Prev. close | $0.28 | 52-week low | $0.20 |
Day low | $0.30 | Volume | 2,570,100 |
Day high | $0.34 | Avg. volume | 3,232,900 |
50-day MA | $0.28 | Dividend yield | N/A |
200-day MA | $2.54 | Market Cap | 1.99M |
Tantech Holdings Ltd. (TANH) Company Bio
Tantech Holdings develops and manufactures bamboo-based charcoal products in the Peoples Republic of China and internationally. It operates through three segments: Consumer Products, Trading, and Biofuel Energy. The company was founded in 2001 and is based in Lishui, China.
Latest TANH News From Around the Web
Below are the latest news stories about Tantech Holdings Ltd that investors may wish to consider to help them evaluate TANH as an investment opportunity.
Tantech (NASDAQ:TANH) Stock Passes Below 50 Day Moving Average of $0.72Tantech Holdings Ltd (NASDAQ:TANH) shares crossed below its 50-day moving average during trading on Thursday . The stock has a 50-day moving average of $0.72 and traded as low as $0.38. Tantech shares last traded at $0.42, with a volume of 2,838,116 shares. The companys 50-day moving average price is $0.72 and its two-hundred day [] The post Tantech (NASDAQ:TANH) Stock Passes Below 50 Day Moving Average of $0.72 appeared first on ETF Daily News . |
Tantech Holdings Ltd (NASDAQ: TANH) Stock: Boom Or Bust? What Happens Next?During the last session, Tantech Holdings Ltd (NASDAQ:TANH)’s traded shares were 1.95 million, with the beta value of the company hitting -0.03. At the end of the trading day, the stock’s price was $0.47, reflecting an intraday loss of -5.35% or -$0.02. The 52-week high for the TANH share is $2.37, that puts it down … Tantech Holdings Ltd (NASDAQ: TANH) Stock: Boom Or Bust? What Happens Next? Read More » |
Tantech Subsidiary Expands Sales into South AmericaTantech Holdings Ltd (NASDAQ: TANH) ("Tantech" or the "Company"), a clean energy company in China, today announced that its subsidiary, Shangchi Automobile Co., Ltd., has won a new order for 10 of its high-quality, highly efficient customizable midibuses. The vehicles will be exported to a customer in Ecuador, with primary use at a local school. |
Today’s Biggest Pre-Market Stock Movers: 10 Top Gainers and Losers on TuesdayGood morning, trader! |
Tantech Subsidiary Receives Milestone Order for Twelve Driverless Street Sweepers; Develops Next Generation Sweeper with Enhanced FeaturesTantech Holdings Ltd (NASDAQ: TANH) ("Tantech" or the "Company"), a clean energy company in China, today announced that its subsidiary, Lishui Smart New Energy Automobile Co., Ltd., received a milestone order for twelve of its highly innovative SC-120A driverless and autonomous street sweepers. The customer is a real estate development and property management company, managing industrial parks and other properties in China. This represents the first order since the recent completion of the final |
TANH Price Returns
1-mo | 25.86% |
3-mo | 15.80% |
6-mo | -88.91% |
1-year | -96.74% |
3-year | -97.91% |
5-year | -98.87% |
YTD | -93.26% |
2021 | -66.69% |
2020 | -23.76% |
2019 | 4.02% |
2018 | -32.56% |
2017 | 27.72% |
Continue Researching TANH
Want to do more research on Tantech Holdings Ltd's stock and its price? Try the links below:Tantech Holdings Ltd (TANH) Stock Price | Nasdaq
Tantech Holdings Ltd (TANH) Stock Quote, History and News - Yahoo Finance
Tantech Holdings Ltd (TANH) Stock Price and Basic Information | MarketWatch
Loading social stream, please wait...