TrueBlue, Inc. (TBI): Price and Financial Metrics
TBI Price/Volume Stats
Current price | $12.52 | 52-week high | $19.06 |
Prev. close | $12.46 | 52-week low | $10.15 |
Day low | $12.47 | Volume | 352,000 |
Day high | $12.66 | Avg. volume | 458,710 |
50-day MA | $12.64 | Dividend yield | N/A |
200-day MA | $14.40 | Market Cap | 392.98M |
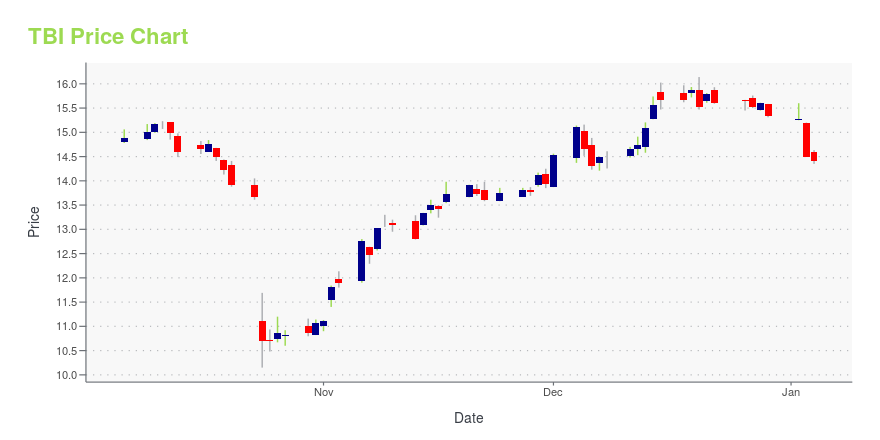
TBI Stock Price Chart Interactive Chart >
TBI POWR Grades
- Value is the dimension where TBI ranks best; there it ranks ahead of 85.7% of US stocks.
- The strongest trend for TBI is in Quality, which has been heading down over the past 26 weeks.
- TBI's current lowest rank is in the Sentiment metric (where it is better than 5.41% of US stocks).
TBI Stock Summary
- The capital turnover (annual revenue relative to shareholder's equity) for TBI is 4.32 -- better than 88.53% of US stocks.
- With a price/sales ratio of 0.23, TRUEBLUE INC has a higher such ratio than merely 6.7% of stocks in our set.
- Over the past twelve months, TBI has reported earnings growth of -106.8%, putting it ahead of merely 12.49% of US stocks in our set.
- Stocks that are quantitatively similar to TBI, based on their financial statements, market capitalization, and price volatility, are MMI, GCO, BV, CVGW, and HUSA.
- TBI's SEC filings can be seen here. And to visit TRUEBLUE INC's official web site, go to www.trueblue.com.
TBI Valuation Summary
- In comparison to the median Industrials stock, TBI's price/sales ratio is 83.33% lower, now standing at 0.2.
- Over the past 243 months, TBI's price/sales ratio has gone down 0.4.
Below are key valuation metrics over time for TBI.
Stock | Date | P/S | P/B | P/E | EV/EBIT |
---|---|---|---|---|---|
TBI | 2023-12-29 | 0.2 | 1.0 | -104.4 | -47.3 |
TBI | 2023-12-28 | 0.2 | 1.1 | -106.1 | -48.6 |
TBI | 2023-12-27 | 0.2 | 1.1 | -105.7 | -48.3 |
TBI | 2023-12-26 | 0.2 | 1.1 | -106.4 | -48.8 |
TBI | 2023-12-22 | 0.2 | 1.1 | -106.1 | -48.6 |
TBI | 2023-12-21 | 0.2 | 1.1 | -107.4 | -49.5 |
TBI Growth Metrics
- Its 2 year net cashflow from operations growth rate is now at -80.93%.
- The 5 year price growth rate now stands at -45.18%.
- Its 2 year net income to common stockholders growth rate is now at 168.19%.
The table below shows TBI's growth in key financial areas (numbers in millions of US dollars).
Date | Revenue | Operating Cash Flow | Net Income to Common Stock |
---|---|---|---|
2022-12-31 | 2,254.184 | 120.503 | 62.273 |
2022-09-30 | 2,318.419 | 99.957 | 75.438 |
2022-06-30 | 2,319.729 | 26.18 | 73.384 |
2022-03-31 | 2,266.431 | 18.999 | 65.255 |
2021-12-31 | 2,173.622 | 20.44 | 61.634 |
2021-09-30 | 2,070.326 | 54.32 | 49.45 |
TBI's Quality Factors
The “Quality” component of the POWR Ratings focuses on 31 different factors of a companies fundamentals and operational strength. Here are some key insights as we drill into the specifics of these quality attributes.- TBI has a Quality Grade of C, ranking ahead of 59.18% of graded US stocks.
- TBI's asset turnover comes in at 2.077 -- ranking 30th of 561 Business Services stocks.
- TTEC, CMPR, and MHH are the stocks whose asset turnover ratios are most correlated with TBI.
The table below shows TBI's key quality metrics over time.
Period | Asset Turnover | Gross Margin | ROIC |
---|---|---|---|
2021-09-26 | 2.077 | 0.248 | 0.149 |
2021-06-27 | 2.025 | 0.243 | 0.134 |
2021-03-28 | 1.921 | 0.235 | 0.024 |
2020-12-27 | 1.881 | 0.239 | -0.403 |
2020-09-27 | 1.880 | 0.245 | -0.387 |
2020-06-28 | 1.933 | 0.254 | -0.336 |
TBI Price Target
For more insight on analysts targets of TBI, see our TBI price target page. And for a list of of all stocks sorted by upside potential based on analyst target price, see our Top Price Target page.
Average Price Target | $33.00 | Average Broker Recommendation | 1.38 (Strong Buy) |
TrueBlue, Inc. (TBI) Company Bio
TrueBlue Inc. is a provider of specialized workforce solutions, helping clients improve growth and performance by providing staffing, recruitment process outsourcing and managed service provider solutions. The company was founded in 1985 and is based in Tacoma, Washington.
Latest TBI News From Around the Web
Below are the latest news stories about TRUEBLUE INC that investors may wish to consider to help them evaluate TBI as an investment opportunity.
TrueBlue Recognized for Women in LeadershipTrueBlue (NYSE: TBI), a leading provider of specialized workforce solutions, is pleased to announce that TrueBlue President and CEO Taryn Owen and PeopleReady President Kristy Willis have been recognized for their impactful leadership in the staffing industry. |
Sidoti Events, LLC's Virtual December Small-Cap ConferenceNEW YORK, NY / ACCESSWIRE / December 5, 2023 / Sidoti Events, LLC, an affiliate of Sidoti & Company, LLC, has released the presentation schedule and weblinks for its two-day December Small-Cap Conference taking place Wednesday and Thursday, December ... |
TrueBlue's PeopleReady Earns Dual Awards for Innovative JobStack AppTrueBlue, a leading provider of specialized workforce solutions, today announced that PeopleReady, a TrueBlue company (NYSE: TBI), has been recognized with two awards from the International Awards Associate (IAA) for its groundbreaking JobStack app. |
TrueBlue to Participate in the Sidoti Virtual Investor ConferenceTACOMA, Wash., November 30, 2023--TrueBlue (NYSE: TBI), a leading provider of specialized workforce solutions, today announced that Chief Executive Officer Taryn Owen and Chief Financial Officer Carl Schweihs will participate in a fireside chat at the Sidoti Virtual Investor Conference on Thursday, December 7, 2023 at 4:00 PM Eastern Time. A live webcast and replay will be available through TrueBlue’s Investor Relations website at investor.trueblue.com and here. Management will also host virtual |
TrueBlue (NYSE:TBI) shareholders have endured a 44% loss from investing in the stock five years agoIn order to justify the effort of selecting individual stocks, it's worth striving to beat the returns from a market... |
TBI Price Returns
1-mo | 7.56% |
3-mo | -18.38% |
6-mo | -14.66% |
1-year | -28.58% |
3-year | -42.14% |
5-year | -47.04% |
YTD | -18.38% |
2023 | -21.65% |
2022 | -29.24% |
2021 | 48.05% |
2020 | -22.32% |
2019 | 8.13% |
Continue Researching TBI
Want to do more research on TrueBlue Inc's stock and its price? Try the links below:TrueBlue Inc (TBI) Stock Price | Nasdaq
TrueBlue Inc (TBI) Stock Quote, History and News - Yahoo Finance
TrueBlue Inc (TBI) Stock Price and Basic Information | MarketWatch
Loading social stream, please wait...