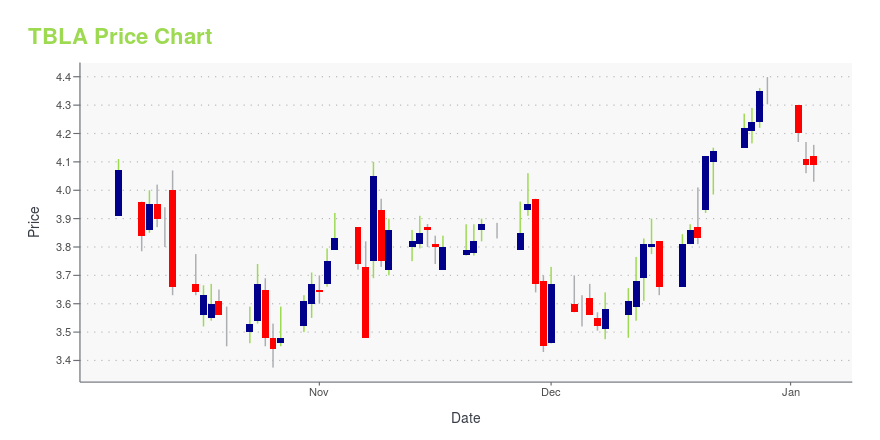
Taboola.com, Ltd. (TBLA): Price and Financial Metrics
TBLA Price/Volume Stats
| Current price | $3.58 | 52-week high | $5.00 |
| Prev. close | $3.55 | 52-week low | $2.87 |
| Day low | $3.58 | Volume | 420,800 |
| Day high | $3.67 | Avg. volume | 628,109 |
| 50-day MA | $3.65 | Dividend yield | N/A |
| 200-day MA | $3.62 | Market Cap | 1.05B |
TBLA Stock Price Chart Interactive Chart >
Taboola.com, Ltd. (TBLA) Company Bio
Taboola.com, Ltd. operates a content discovery and native advertising platform for people, advertisers, and digital properties. It offers Taboola, a platform that helps people to find relevant content online, matching them with news stories, articles, blogs, videos, apps, products, and other content they want to explore; helps advertisers promote their brand to their audience; and provides new engagement and monetization opportunities to publishers, mobile carriers, and other digital properties. The company was founded in 2007 and is based in Ramat Gan, Israel.
TBLA Price Returns
| 1-mo | -6.77% |
| 3-mo | -2.19% |
| 6-mo | 9.15% |
| 1-year | -13.94% |
| 3-year | -36.07% |
| 5-year | N/A |
| YTD | -1.92% |
| 2024 | -15.70% |
| 2023 | 40.58% |
| 2022 | -60.41% |
| 2021 | N/A |
| 2020 | N/A |


Loading social stream, please wait...