
Texas Capital Bancshares, Inc. (TCBI): Price and Financial Metrics
TCBI Price/Volume Stats
| Current price | $67.30 | 52-week high | $72.07 |
| Prev. close | $66.20 | 52-week low | $52.89 |
| Day low | $66.57 | Volume | 340,242 |
| Day high | $68.00 | Avg. volume | 430,424 |
| 50-day MA | $61.22 | Dividend yield | N/A |
| 200-day MA | $59.60 | Market Cap | 3.14B |
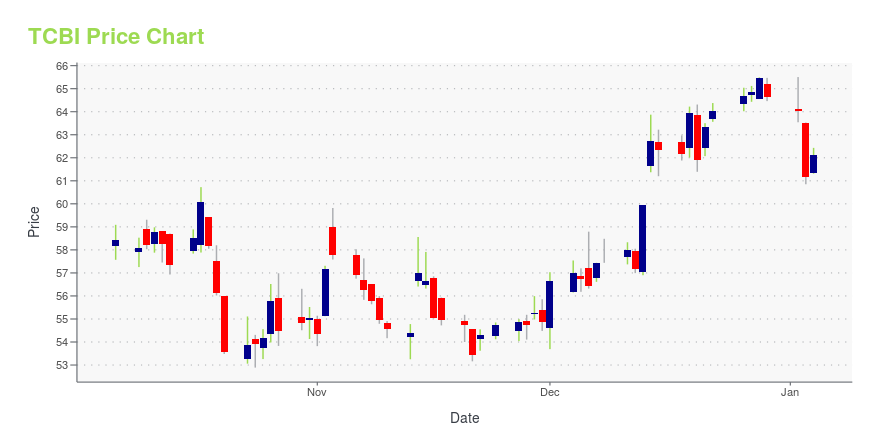
TCBI Stock Price Chart Interactive Chart >
Texas Capital Bancshares, Inc. (TCBI) Company Bio
Texas Capital Bancshares provides various banking products and services for commercial businesses and consumers in Texas. The company was founded in 1996 and is based in Dallas, Texas.
Latest TCBI News From Around the Web
Below are the latest news stories about TEXAS CAPITAL BANCSHARES INC that investors may wish to consider to help them evaluate TCBI as an investment opportunity.
Solid Balance Sheet Aids Texas Capital (TCBI) Despite High CostsTexas Capital's (TCBI) relationship-based business model is likely to support loan and deposit growth. Yet, escalating operating expenses and deteriorating credit quality are major near-term headwinds. |
Texas Capital Expands ETF Portfolio with Two New Innovative OfferingsThe TXSS and OILT ETFs further enable the world to invest in the strength of the Texas economyDALLAS, Dec. 21, 2023 (GLOBE NEWSWIRE) -- Texas Capital Bancshares, Inc. (NASDAQ: TCBI), the parent company of Texas Capital, today announced the launch of the Texas Capital Texas Small Cap Equity Index ETF (NASDAQ: TXSS) and the Texas Capital Texas Oil Index ETF (NYSE Arca: OILT). The TXSS ETF will track the performance of the Texas Capital Texas Small Cap Equity Index, a sector GDP weighted and market |
Bankrate Recognizes Texas Capital as the Best Regional Bank in 2024DALLAS, Dec. 13, 2023 (GLOBE NEWSWIRE) -- Texas Capital Bancshares, Inc. (NASDAQ: TCBI), the parent company of Texas Capital, announced today the firm has been named by Bankrate as the Best Regional Bank in the consumer financial services company’s award program for 2024.Bankrate's evaluation process for the best regional bank category involved a comprehensive analysis of financial institutions with fewer than 500 branches in the U.S., focusing on their presence within a specific region. The cri |
Should You Be Adding Texas Capital Bancshares (NASDAQ:TCBI) To Your Watchlist Today?For beginners, it can seem like a good idea (and an exciting prospect) to buy a company that tells a good story to... |
Texas Capital and FHLB Dallas Celebrate the Opening of Senior Apartment Community in Stop Six Neighborhood of Fort WorthFORT WORTH, TX / ACCESSWIRE / December 8, 2023 / Local real estate developers, community partners and residents celebrated the grand opening of Cowan Place Senior Living. It was built with the assistance of a $750,000 Affordable Housing Program (AHP) ... |
TCBI Price Returns
| 1-mo | 14.26% |
| 3-mo | 16.42% |
| 6-mo | 8.95% |
| 1-year | 7.75% |
| 3-year | 6.93% |
| 5-year | 8.41% |
| YTD | 4.13% |
| 2023 | 7.16% |
| 2022 | 0.10% |
| 2021 | 1.26% |
| 2020 | 4.81% |
| 2019 | 11.12% |
Continue Researching TCBI
Here are a few links from around the web to help you further your research on Texas Capital Bancshares Inc's stock as an investment opportunity:Texas Capital Bancshares Inc (TCBI) Stock Price | Nasdaq
Texas Capital Bancshares Inc (TCBI) Stock Quote, History and News - Yahoo Finance
Texas Capital Bancshares Inc (TCBI) Stock Price and Basic Information | MarketWatch
Loading social stream, please wait...