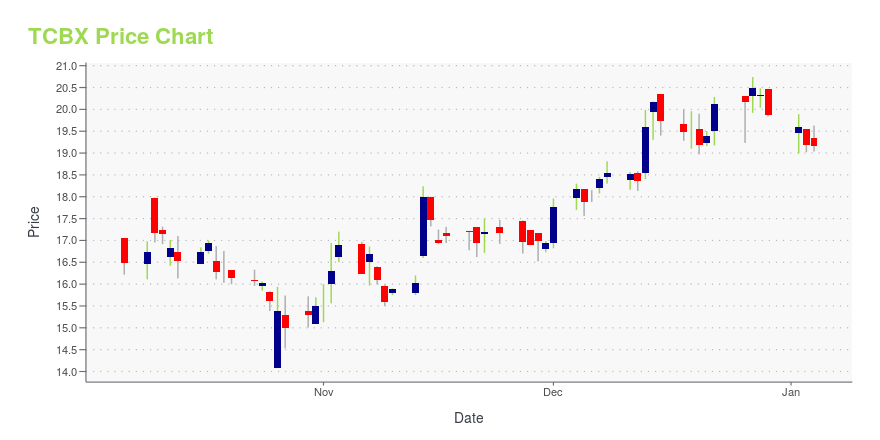
Third Coast Bancshares, Inc. (TCBX) Company Bio
Third Coast Bancshares, Inc. operates as a bank holding company for Third Coast Bank, SSB that provides various commercial banking solutions to small and medium-sized businesses, and professionals. The company's deposit products include demand, checking, savings, individual retirement, money market, and time accounts, as well as certificates of deposit. It also offers commercial and industrial loans, such as equipment loans, working capital lines of credit, auto finance, and commercial finance; and commercial and residential real estate, construction and development, small business administration, and consumer loans. In addition, the company provides treasury management, wealth management, online and mobile banking, night depository, safe-deposit box, automatic draft, ACH origination, positive pay, remote deposit capture, sweep, and online wire transfer services, as well as debit cards. It operates through seven branches in Greater Houston, two branches in Dallas-Fort Worth, two branches in Austin-San Antonio, and one branch in Detroit, Texas. The company was founded in 2008 and is headquartered in Humble, Texas.


Loading social stream, please wait...