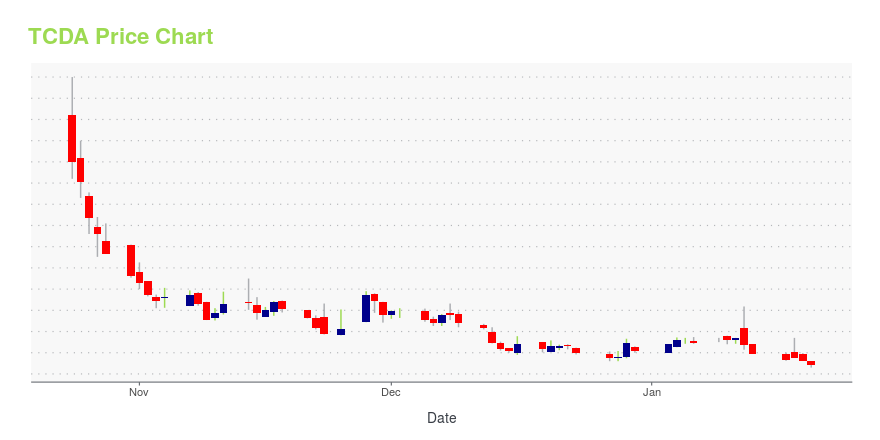
Tricida, Inc. (TCDA): Price and Financial Metrics
TCDA Price/Volume Stats
| Current price | $0.11 | 52-week high | $13.85 |
| Prev. close | $0.12 | 52-week low | $0.09 |
| Day low | $0.09 | Volume | 31,125,300 |
| Day high | $0.12 | Avg. volume | 17,618,414 |
| 50-day MA | $0.20 | Dividend yield | N/A |
| 200-day MA | $7.26 | Market Cap | 6.01M |
TCDA Stock Price Chart Interactive Chart >
Tricida, Inc. (TCDA) Company Bio
Tricida, Inc., a late-stage pharmaceutical company, focuses on developing therapeutics to address renal, metabolic, and cardiovascular disease. Its lead product candidate, TRC101, a non-absorbed orally-administered polymer drug that is in Phase III clinical trials used to treat metabolic acidosis in patients with chronic kidney disease. The company was founded in 2013 and is based in South San Francisco, California.
TCDA Price Returns
| 1-mo | N/A |
| 3-mo | N/A |
| 6-mo | N/A |
| 1-year | N/A |
| 3-year | -98.84% |
| 5-year | -99.64% |
| YTD | N/A |
| 2024 | N/A |
| 2023 | 0.00% |
| 2022 | -98.40% |
| 2021 | 35.60% |
| 2020 | -81.32% |


Loading social stream, please wait...