
Transcontinental Realty Investors, Inc. (TCI): Price and Financial Metrics
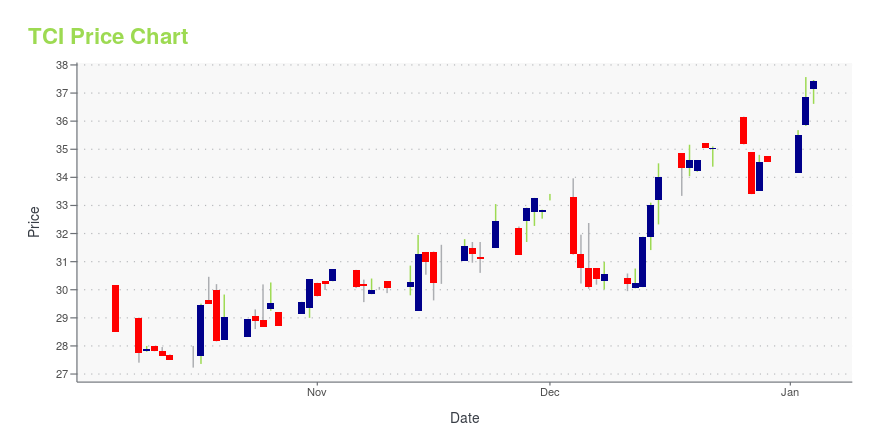
TCI Price/Volume Stats
| Current price | $31.16 | 52-week high | $43.40 |
| Prev. close | $30.55 | 52-week low | $27.04 |
| Day low | $30.77 | Volume | 1,936 |
| Day high | $31.28 | Avg. volume | 5,807 |
| 50-day MA | $28.90 | Dividend yield | N/A |
| 200-day MA | $32.96 | Market Cap | 269.22M |
TCI Stock Price Chart Interactive Chart >
Transcontinental Realty Investors, Inc. (TCI) Company Bio
Transcontinental Realty Investors, Inc. acquires, develops, and owns residential and commercial real estate properties through acquisitions, leases, and partnerships in the United States. The company was founded in 1983 and based in Dallas, Texas.
Latest TCI News From Around the Web
Below are the latest news stories about TRANSCONTINENTAL REALTY INVESTORS INC that investors may wish to consider to help them evaluate TCI as an investment opportunity.
Transcontinental Realty Investors Third Quarter 2023 Earnings: EPS: US$0.52 (vs US$43.79 in 3Q 2022)Transcontinental Realty Investors ( NYSE:TCI ) Third Quarter 2023 Results Key Financial Results Revenue: US$12.5m (down... |
Transcontinental Realty Investors, Inc. reports Earnings for Quarter Ended September 30, 2023DALLAS, November 09, 2023--Transcontinental Realty Investors, Inc. (NYSE:TCI) is reporting its results of operations for the three months ended September 30, 2023. For the three months ended September 30, 2023, we reported net income attributable to common shares of $4.5 million or $0.52 per diluted share, compared to a net income of $378.4 million or $43.79 per diluted share for the same period in 2022. |
Transcontinental Realty Investors Inc Reports Q3 2023 Earnings with Net Income of $4.5 MillionTCI Sees a Shift in Net Income Attributable to Common Shares Year-Over-Year |
Those who invested in Transcontinental Realty Investors (NYSE:TCI) three years ago are up 26%It hasn't been the best quarter for Transcontinental Realty Investors, Inc. ( NYSE:TCI ) shareholders, since the share... |
Transcontinental Realty Investors, Inc. Reports Earnings for Quarter Ended June 30, 2023DALLAS, August 10, 2023--Transcontinental Realty Investors, Inc. (NYSE:TCI) is reporting its results of operations for the quarter ended June 30, 2023. For the three months ended June 30, 2023, we reported net income attributable to common shares of $0.5 million or $0.06 per diluted share, compared to a net income of $16.5 million or $1.91 per diluted share for the same period in 2022. |
TCI Price Returns
| 1-mo | 9.83% |
| 3-mo | 7.60% |
| 6-mo | -22.99% |
| 1-year | -10.25% |
| 3-year | -16.91% |
| 5-year | 25.90% |
| YTD | -9.84% |
| 2023 | -21.77% |
| 2022 | 12.99% |
| 2021 | 62.17% |
| 2020 | -39.54% |
| 2019 | 40.82% |
Continue Researching TCI
Want to do more research on Transcontinental Realty Investors Inc's stock and its price? Try the links below:Transcontinental Realty Investors Inc (TCI) Stock Price | Nasdaq
Transcontinental Realty Investors Inc (TCI) Stock Quote, History and News - Yahoo Finance
Transcontinental Realty Investors Inc (TCI) Stock Price and Basic Information | MarketWatch
Loading social stream, please wait...