Tucows Inc. (TCX): Price and Financial Metrics
TCX Price/Volume Stats
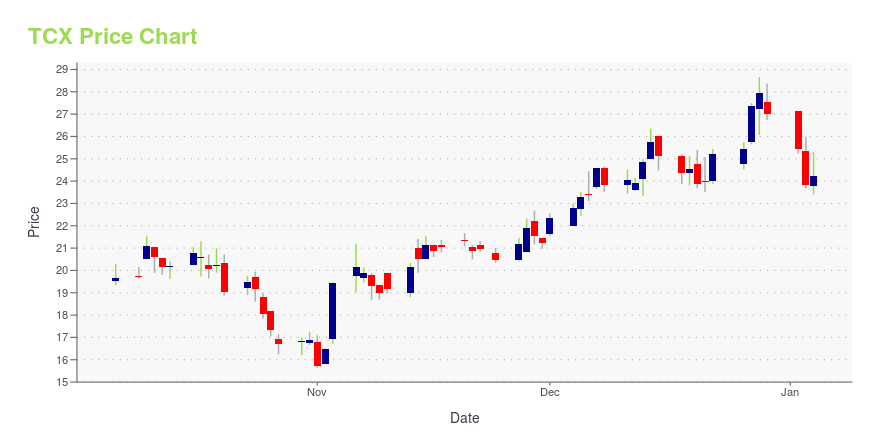
Current price | $18.56 | 52-week high | $33.44 |
Prev. close | $18.55 | 52-week low | $15.65 |
Day low | $18.45 | Volume | 22,100 |
Day high | $18.94 | Avg. volume | 36,420 |
50-day MA | $20.49 | Dividend yield | N/A |
200-day MA | $22.57 | Market Cap | 202.21M |
TCX Stock Price Chart Interactive Chart >
TCX POWR Grades
- Value is the dimension where TCX ranks best; there it ranks ahead of 66.72% of US stocks.
- The strongest trend for TCX is in Growth, which has been heading up over the past 26 weeks.
- TCX's current lowest rank is in the Growth metric (where it is better than 14.32% of US stocks).
TCX Stock Summary
- TUCOWS INC's capital turnover -- a measure of revenue relative to shareholder's equity -- is better than 96.57% of US listed stocks.
- Over the past twelve months, TCX has reported earnings growth of 2,792%, putting it ahead of 99.68% of US stocks in our set.
- Shareholder yield, a measure of how much is returned to shareholders via dividends and share repurchases, for TCX comes in at -58.2% -- higher than that of just 7.05% of stocks in our set.
- Stocks that are quantitatively similar to TCX, based on their financial statements, market capitalization, and price volatility, are WFRD, BVN, BOXL, MAPS, and ESTA.
- TCX's SEC filings can be seen here. And to visit TUCOWS INC's official web site, go to www.tucows.com.
TCX Valuation Summary
- In comparison to the median Technology stock, TCX's price/earnings ratio is 111.26% lower, now standing at -3.
- Over the past 243 months, TCX's price/sales ratio has gone down 0.
Below are key valuation metrics over time for TCX.
Stock | Date | P/S | P/B | P/E | EV/EBIT |
---|---|---|---|---|---|
TCX | 2023-12-08 | 0.8 | 8.6 | -3.0 | -10.6 |
TCX | 2023-12-07 | 0.8 | 8.9 | -3.1 | -10.7 |
TCX | 2023-12-06 | 0.8 | 8.5 | -3.0 | -10.5 |
TCX | 2023-12-05 | 0.8 | 8.5 | -2.9 | -10.5 |
TCX | 2023-12-04 | 0.7 | 8.3 | -2.9 | -10.4 |
TCX | 2023-12-01 | 0.7 | 8.1 | -2.8 | -10.3 |
TCX Growth Metrics
- Its 4 year revenue growth rate is now at 59.22%.
- Its 3 year revenue growth rate is now at -4.44%.
- The 2 year revenue growth rate now stands at -8.07%.
The table below shows TCX's growth in key financial areas (numbers in millions of US dollars).
Date | Revenue | Operating Cash Flow | Net Income to Common Stock |
---|---|---|---|
2022-09-30 | 324.709 | 27.517 | -16.093 |
2022-06-30 | 322.552 | 30.017 | -6.737 |
2022-03-31 | 314.561 | 20.959 | -1.805 |
2021-12-31 | 304.337 | 29.637 | 3.364 |
2021-09-30 | 292.645 | 20.733 | 7.399 |
2021-06-30 | 291.063 | 30.673 | 6.74 |
TCX's Quality Factors
The “Quality” component of the POWR Ratings focuses on 31 different factors of a companies fundamentals and operational strength. Here are some key insights as we drill into the specifics of these quality attributes.- TCX has a Quality Grade of C, ranking ahead of 45.06% of graded US stocks.
- TCX's asset turnover comes in at 0.618 -- ranking 262nd of 563 Business Services stocks.
- APPF, HEES, and VSEC are the stocks whose asset turnover ratios are most correlated with TCX.
The table below shows TCX's key quality metrics over time.
Period | Asset Turnover | Gross Margin | ROIC |
---|---|---|---|
2021-09-30 | 0.618 | 0.243 | 0.052 |
2021-06-30 | 0.631 | 0.251 | 0.057 |
2021-03-31 | 0.661 | 0.261 | 0.056 |
2020-12-31 | 0.701 | 0.275 | 0.063 |
2020-09-30 | 0.746 | 0.288 | 0.087 |
2020-06-30 | 0.789 | 0.299 | 0.121 |
Tucows Inc. (TCX) Company Bio
Tucows Inc. is a provider of network access, domain names and other Internet services. The company was founded in 1992 and is based in Toronto, Canada.
Latest TCX News From Around the Web
Below are the latest news stories about TUCOWS INC that investors may wish to consider to help them evaluate TCX as an investment opportunity.
With 70% institutional ownership, Tucows Inc. (NASDAQ:TCX) is a favorite amongst the big gunsKey Insights Significantly high institutional ownership implies Tucows' stock price is sensitive to their trading... |
Tucows Independent Chairman Acquires 75% More StockInvestors who take an interest in Tucows Inc. ( NASDAQ:TCX ) should definitely note that the Independent Chairman... |
Tucows (NASDAQ:TCX) shareholders are up 16% this past week, but still in the red over the last three yearsTucows Inc. ( NASDAQ:TCX ) shareholders should be happy to see the share price up 16% in the last week. But the last... |
Tucows Reports Financial Results for Third Quarter 2023Tucows Inc. (NASDAQ: TCX) (TSX: TC), a global internet services leader, today reported its financial results for the third quarter ended September 30, 2023. All figures are in U.S. dollars. |
TING SELECTED AS BLUE SUEDE NETWORKS' FIBER INTERNET SERVICE PROVIDERTing Internet, a division of Tucows (NASDAQ: TCX) (TSX: TC), announced that it has been selected to provide fiber internet service to Memphis residents, businesses, and institutions in partnership with Blue Suede Networks. |
TCX Price Returns
1-mo | -2.26% |
3-mo | -31.26% |
6-mo | -9.06% |
1-year | -0.85% |
3-year | -76.42% |
5-year | -77.14% |
YTD | -31.26% |
2023 | -20.40% |
2022 | -59.53% |
2021 | 13.44% |
2020 | 19.60% |
2019 | 2.86% |
Continue Researching TCX
Want to see what other sources are saying about Tucows Inc's financials and stock price? Try the links below:Tucows Inc (TCX) Stock Price | Nasdaq
Tucows Inc (TCX) Stock Quote, History and News - Yahoo Finance
Tucows Inc (TCX) Stock Price and Basic Information | MarketWatch
Loading social stream, please wait...