TG Venture Acquisition Corp. (TGVCU): Price and Financial Metrics
TGVCU Price/Volume Stats
| Current price | $10.35 | 52-week high | $11.27 |
| Prev. close | $10.56 | 52-week low | $9.72 |
| Day low | $10.35 | Volume | 100 |
| Day high | $10.35 | Avg. volume | 100 |
| 50-day MA | $10.29 | Dividend yield | N/A |
| 200-day MA | $0.00 | Market Cap | N/A |
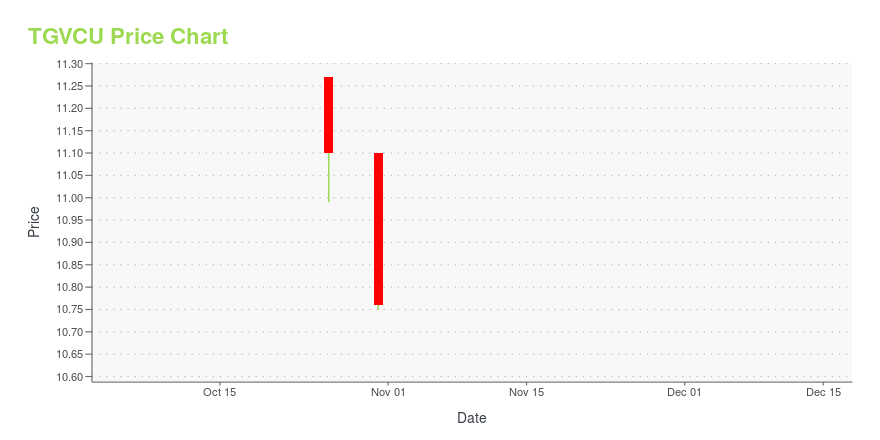
TGVCU Stock Price Chart Interactive Chart >
TG Venture Acquisition Corp. (TGVCU) Company Bio
TG Venture Acquisition Corp. focuses on effecting a merger, capital stock exchange, asset acquisition, stock purchase, reorganization, or similar business combination with one or more businesses. The company was incorporated in 2021 and is based in San Francisco, California.
TGVCU Price Returns
| 1-mo | N/A |
| 3-mo | N/A |
| 6-mo | N/A |
| 1-year | N/A |
| 3-year | N/A |
| 5-year | N/A |
| YTD | N/A |
| 2024 | N/A |
| 2023 | N/A |
| 2022 | N/A |
| 2021 | N/A |
| 2020 | N/A |


Loading social stream, please wait...