
Gentherm Inc (THRM): Price and Financial Metrics
THRM Price/Volume Stats
| Current price | $51.06 | 52-week high | $66.54 |
| Prev. close | $49.50 | 52-week low | $38.21 |
| Day low | $48.92 | Volume | 205,388 |
| Day high | $51.15 | Avg. volume | 172,901 |
| 50-day MA | $50.95 | Dividend yield | N/A |
| 200-day MA | $50.70 | Market Cap | 1.62B |
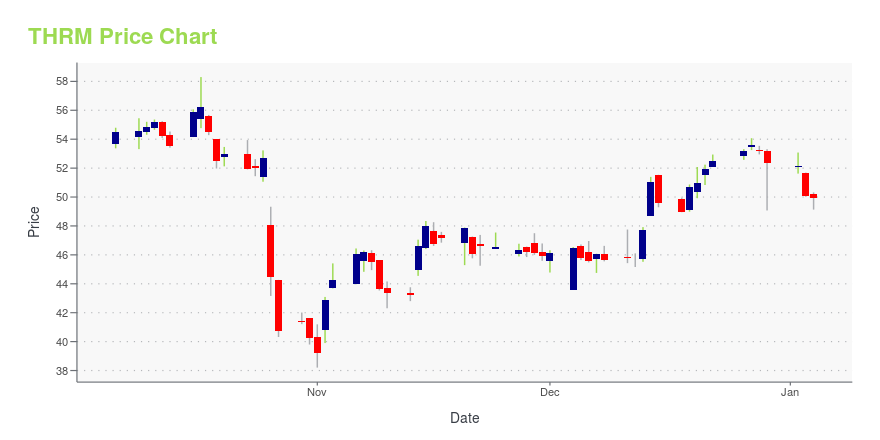
THRM Stock Price Chart Interactive Chart >
Gentherm Inc (THRM) Company Bio
Gentherm Incorporated is a global developer and marketer of innovative thermal management technologies for a broad range of heating and cooling and temperature control applications. The company was founded in 1968 and is based in Northville, Michigan.
Latest THRM News From Around the Web
Below are the latest news stories about GENTHERM INC that investors may wish to consider to help them evaluate THRM as an investment opportunity.
Gentherm Announces Laura Kowalchik as New Independent DirectorNORTHVILLE, Mich., Dec. 06, 2023 (GLOBE NEWSWIRE) -- Gentherm (NASDAQ: THRM), the global market leader of innovative thermal management and pneumatic comfort technologies for the automotive industry and a leader in medical patient temperature management systems, today announced that Laura Kowalchik has been appointed to the Company’s Board of Directors, effective December 1, 2023. Kowalchik is the Chief Financial Officer of Communications & Power Industries LLC (“CPI”), a global manufacturer of |
What Does Gentherm Incorporated's (NASDAQ:THRM) Share Price Indicate?Gentherm Incorporated ( NASDAQ:THRM ), might not be a large cap stock, but it saw a double-digit share price rise of... |
Gentherm Named a Winner of The Michigan Top Workplaces 2023 Award by The Detroit Free PressNORTHVILLE, Mich., Nov. 20, 2023 (GLOBE NEWSWIRE) -- Gentherm (NASDAQ: THRM), the global market leader of innovative thermal management and pneumatic comfort technologies for the automotive industry and a leader in medical patient temperature management systems, today announced that the Company has been awarded a Top Workplaces 2023 honor by The Detroit Free Press for its Michigan locations. This is the second time Gentherm has received this award. The list of Top Workplace winners was determine |
Is Gentherm Incorporated (NASDAQ:THRM) Trading At A 21% Discount?Key Insights Gentherm's estimated fair value is US$55.70 based on 2 Stage Free Cash Flow to Equity Gentherm is... |
Gentherm Initiates $60 Million Accelerated Share RepurchaseStock Repurchase Authorization Extended until June 2024NORTHVILLE, Mich., Nov. 02, 2023 (GLOBE NEWSWIRE) -- Gentherm (NASDAQ:THRM), the global market leader of innovative thermal management and pneumatic comfort technologies for the automotive industry and a leader in medical patient temperature management systems, today announced that it has entered into an accelerated share repurchase agreement (ASR) with Bank of America, N.A. to repurchase an aggregate of $60 million of Gentherm’s common shar |
THRM Price Returns
| 1-mo | 4.76% |
| 3-mo | 0.93% |
| 6-mo | 4.91% |
| 1-year | -9.79% |
| 3-year | -27.85% |
| 5-year | 22.45% |
| YTD | -2.48% |
| 2023 | -19.80% |
| 2022 | -24.87% |
| 2021 | 33.24% |
| 2020 | 46.92% |
| 2019 | 11.03% |
Continue Researching THRM
Want to do more research on GENTHERM Inc's stock and its price? Try the links below:GENTHERM Inc (THRM) Stock Price | Nasdaq
GENTHERM Inc (THRM) Stock Quote, History and News - Yahoo Finance
GENTHERM Inc (THRM) Stock Price and Basic Information | MarketWatch
Loading social stream, please wait...