
Millicom International Cellular S.A. (TIGO): Price and Financial Metrics
TIGO Price/Volume Stats
| Current price | $24.55 | 52-week high | $25.94 |
| Prev. close | $24.55 | 52-week low | $14.46 |
| Day low | $24.51 | Volume | 49,768 |
| Day high | $24.75 | Avg. volume | 103,934 |
| 50-day MA | $24.31 | Dividend yield | N/A |
| 200-day MA | $19.50 | Market Cap | 2.50B |
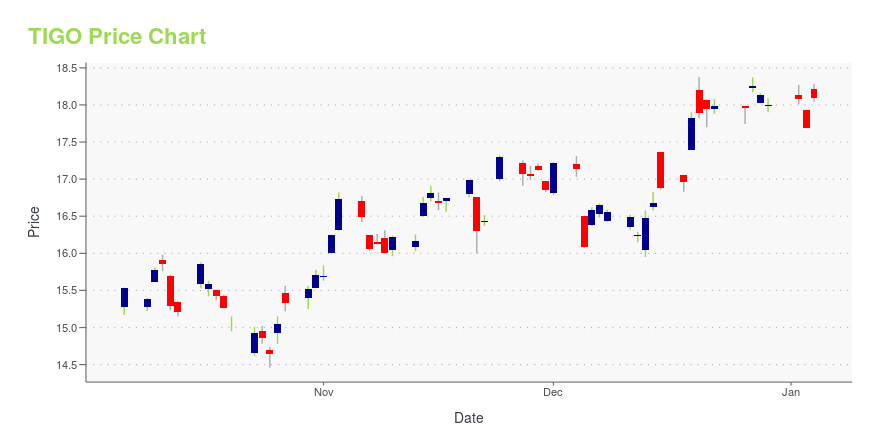
TIGO Stock Price Chart Interactive Chart >
Millicom International Cellular S.A. (TIGO) Company Bio
Millicom International Cellular S.A. is a dedicated emerging markets telecom provider with mobile operations in numerous countries in Central America, South America and Africa. The Company also offers various combinations of fixed broadband and cable TV services in multiple countries in Central America.
Latest TIGO News From Around the Web
Below are the latest news stories about MILLICOM INTERNATIONAL CELLULAR SA that investors may wish to consider to help them evaluate TIGO as an investment opportunity.
Millicom (Tigo) share repurchase activityMillicom (Tigo) share repurchase activity Luxembourg, December 22, 2023 – Pursuant to the share repurchase program announced on December 15, 2023, Millicom repurchased 170,724 of its Swedish Depository Receipts (SDRs) between December 19, 2023 and December 22, 2023, as detailed in the table below. Trade DateNumber of SDRs repurchasedDaily average price paid* (SEK) Daily repurchase amount* (SEK)12/19/202359,965177.713410,656,58412/20/202358,80027,57924,38027,579184.815910,867,17512/21/202327,5791 |
Millicom (Tigo) raises target and launches share repurchase programMillicom (Tigo) raises target and launches share repurchase program Luxembourg, December 14, 2023 – Millicom announced today changes to its financial target and the launch of a new share repurchase program to fund employee share plans. Raised target Millicom is raising its target of cumulative Equity Free Cash Flow (EFCF1) for the 2022-2024 period to “around $600 million”, from “at least $500 million” previously. The more ambitious target reflects higher expected savings from Project Everest, th |
Millicom International Cellular S.A. (NASDAQ:TIGO) Q3 2023 Earnings Call TranscriptMillicom International Cellular S.A. (NASDAQ:TIGO) Q3 2023 Earnings Call Transcript October 26, 2023 Operator: Hello, everyone. Thanks for taking the time to connect to our Third Quarter 2023 Results Conference Call. This event is being recorded. Our speakers today will be our CEO, Mauricio Ramos; and our CFO, Sheldon Bruha; and our President and COO, […] |
Millicom International Cellular S.A. (NASDAQ:TIGO) has caught the attention of institutional investors who hold a sizeable 47% stakeKey Insights Given the large stake in the stock by institutions, Millicom International Cellular's stock price might be... |
Millicom (Tigo) Q3 2023 Earnings ReleaseLuxembourg, October 26, 2023 – Millicom is pleased to announce its third quarter 2023 results. Please find below links to the Q3 2023 Earnings Release and IAS 34 Interim Condensed Consolidated Financial Statements. Highlights* Revenue grew 2.6%, reflecting both organic growth and the effect of stronger currencies. Excluding currency impacts, revenue increased 1.4% year-on-year.Service revenue increased 1.8% organically, as Mobile accelerated to 3.0% in Q3 fueled by improved ARPU trends, while Fi |
TIGO Price Returns
| 1-mo | 6.32% |
| 3-mo | 21.84% |
| 6-mo | 38.47% |
| 1-year | 58.28% |
| 3-year | -41.88% |
| 5-year | -52.58% |
| YTD | 36.39% |
| 2023 | 42.52% |
| 2022 | -55.61% |
| 2021 | -26.64% |
| 2020 | -19.59% |
| 2019 | -20.28% |
Loading social stream, please wait...