
Interface, Inc. (TILE): Price and Financial Metrics
TILE Price/Volume Stats
| Current price | $17.40 | 52-week high | $18.47 |
| Prev. close | $17.11 | 52-week low | $8.26 |
| Day low | $17.15 | Volume | 403,417 |
| Day high | $17.86 | Avg. volume | 405,488 |
| 50-day MA | $15.41 | Dividend yield | 0.23% |
| 200-day MA | $13.56 | Market Cap | 1.01B |
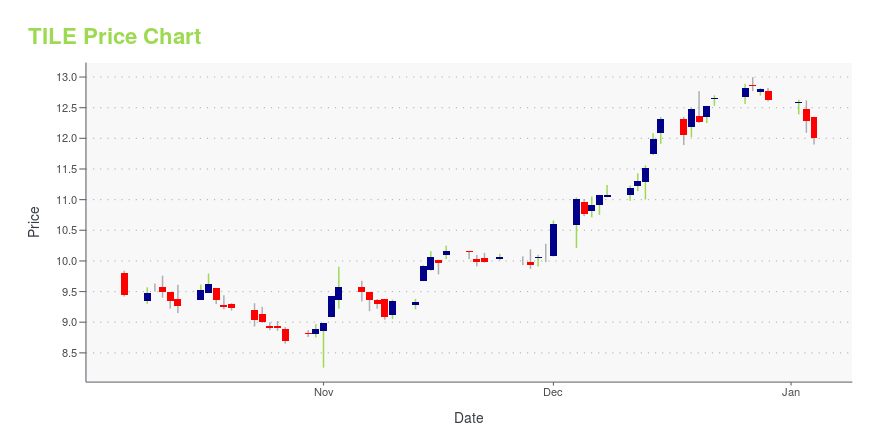
TILE Stock Price Chart Interactive Chart >
Interface, Inc. (TILE) Company Bio
Interface Inc. designs, produces, and sells modular carpet products primarily in the Americas, Europe, and the Asia-Pacific. It offers modular carpets under the Interface and FLOR brands; and carpet tiles under the GlasBacRE brand name for use in commercial interiors, including offices, healthcare facilities, airports, educational and other institutions, hospitality spaces, and retail facilities, as well as residential interiors. The company was founded in 1973 and is based in Atlanta, Georgia.
Latest TILE News From Around the Web
Below are the latest news stories about INTERFACE INC that investors may wish to consider to help them evaluate TILE as an investment opportunity.
Interface Elects Catherine Marcus to Board of DirectorsATLANTA, December 07, 2023--Interface, Inc., the global flooring solutions company and leader in sustainability, has appointed Catherine Marcus to its Board of Directors. |
Sidoti Events, LLC's Virtual December Small-Cap ConferenceNEW YORK, NY / ACCESSWIRE / December 5, 2023 / Sidoti Events, LLC, an affiliate of Sidoti & Company, LLC, has released the presentation schedule and weblinks for its two-day December Small-Cap Conference taking place Wednesday and Thursday, December ... |
Interface (NASDAQ:TILE) Hasn't Managed To Accelerate Its ReturnsFinding a business that has the potential to grow substantially is not easy, but it is possible if we look at a few key... |
FLOR Returns to Modernism Week as a 2024 Premier SponsorATLANTA, November 28, 2023--FLOR®, a high-end area rug brand for homes, offices, and every space in between, returns to Modernism Week 2024 as the Premier Sponsor for flooring solutions. The annual 11-day event celebrates midcentury modern design, architecture, art, fashion, and culture in Palm Springs, CA, and will take place from February 15-25, 2024. |
Interface Declares Regular Quarterly DividendATLANTA, November 14, 2023--Interface, Inc. (Nasdaq: TILE), the global flooring solutions company, today announced that its Board of Directors has declared a regular quarterly cash dividend of $0.01 per share, payable December 15, 2023 to shareholders of record as of December 1, 2023. |
TILE Price Returns
| 1-mo | 19.67% |
| 3-mo | 11.54% |
| 6-mo | 41.17% |
| 1-year | 80.14% |
| 3-year | 22.80% |
| 5-year | 24.65% |
| YTD | 38.04% |
| 2023 | 28.46% |
| 2022 | -37.92% |
| 2021 | 52.33% |
| 2020 | -35.88% |
| 2019 | 18.47% |
TILE Dividends
| Ex-Dividend Date | Type | Payout Amount | Change | ||||||
|---|---|---|---|---|---|---|---|---|---|
| Loading, please wait... | |||||||||
Continue Researching TILE
Want to see what other sources are saying about Interface Inc's financials and stock price? Try the links below:Interface Inc (TILE) Stock Price | Nasdaq
Interface Inc (TILE) Stock Quote, History and News - Yahoo Finance
Interface Inc (TILE) Stock Price and Basic Information | MarketWatch
Loading social stream, please wait...