
TIAN RUIXIANG Holdings Ltd (TIRX): Price and Financial Metrics
TIRX Price/Volume Stats
| Current price | $1.86 | 52-week high | $10.70 |
| Prev. close | $2.18 | 52-week low | $1.70 |
| Day low | $1.70 | Volume | 283,296 |
| Day high | $2.10 | Avg. volume | 457,290 |
| 50-day MA | $2.43 | Dividend yield | N/A |
| 200-day MA | $3.00 | Market Cap | 1.04M |
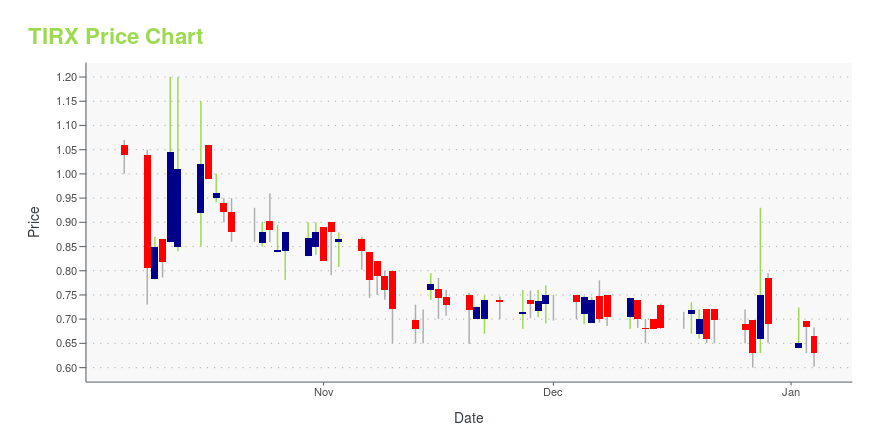
TIRX Stock Price Chart Interactive Chart >
TIAN RUIXIANG Holdings Ltd (TIRX) Company Bio
TIAN RUIXIANG Holdings Ltd operates as a holding company. The Company, through its subsidiaries, provides claims processing, payment reminders, policy review, risk survey, and other insurance related services. TIAN RUIXIANG Holdings serves customers in China.
Latest TIRX News From Around the Web
Below are the latest news stories about TIAN RUIXIANG HOLDINGS LTD that investors may wish to consider to help them evaluate TIRX as an investment opportunity.
Why Is Super League Gaming (SLGG) Stock Down 33% Today?Super League Gaming (SLGG) stock is falling on Monday after the esports entertainment company announced a proposed share offering. |
Why Is Tian Ruixiang (TIRX) Stock Up 53% Today?Tian Ruixiang (TIRX) stock is rising higher on Monday after the company revealed a share transfer for 61.22% of its voting power. |
ESTE Stock Alert: The $4.5 Billion Reason Earthstone Energy Is Up TodayEarthstone Energy (ESTE) stock is rallying on Monday after the oil and gas company reached a $4.5 billion deal with Permian Resources (PR). |
Why Is NAPCO Security Techs (NSSC) Stock Down 37% Today?NAPCO Security Techs (NSSC) stock is falling on Monday following the release of preliminary results for its fiscal Q4 earnings report. |
Today’s Biggest Pre-Market Stock Movers: 10 Top Gainers and Losers on MondayIt's time to start the week off right with a look at the biggest pre-market stock movers worth watching on Monday morning! |
TIRX Price Returns
| 1-mo | -15.45% |
| 3-mo | -25.61% |
| 6-mo | -31.96% |
| 1-year | -68.74% |
| 3-year | -98.18% |
| 5-year | N/A |
| YTD | -46.09% |
| 2023 | -62.95% |
| 2022 | -77.70% |
| 2021 | N/A |
| 2020 | N/A |
| 2019 | N/A |
Loading social stream, please wait...