Tilly's, Inc. (TLYS): Price and Financial Metrics
TLYS Price/Volume Stats
Current price | $8.12 | 52-week high | $10.35 |
Prev. close | $8.13 | 52-week low | $6.05 |
Day low | $7.90 | Volume | 91,600 |
Day high | $8.21 | Avg. volume | 186,362 |
50-day MA | $8.40 | Dividend yield | N/A |
200-day MA | $8.04 | Market Cap | 243.28M |
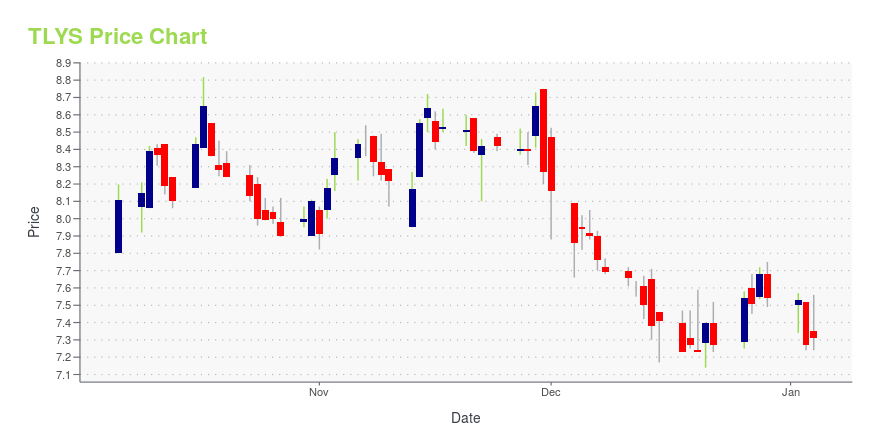
TLYS Stock Price Chart Interactive Chart >
TLYS POWR Grades
- TLYS scores best on the Sentiment dimension, with a Sentiment rank ahead of 85.75% of US stocks.
- The strongest trend for TLYS is in Value, which has been heading down over the past 177 days.
- TLYS's current lowest rank is in the Growth metric (where it is better than 5.68% of US stocks).
TLYS Stock Summary
- The price/operating cash flow metric for TILLY'S INC is higher than 98.02% of stocks in our set with a positive cash flow.
- Of note is the ratio of TILLY'S INC's sales and general administrative expense to its total operating expenses; 87.23% of US stocks have a lower such ratio.
- Over the past twelve months, TLYS has reported earnings growth of -120.9%, putting it ahead of just 11.48% of US stocks in our set.
- Stocks that are quantitatively similar to TLYS, based on their financial statements, market capitalization, and price volatility, are GBR, CTIB, MSB, ELMD, and FLS.
- TLYS's SEC filings can be seen here. And to visit TILLY'S INC's official web site, go to www.tillys.com.
TLYS Valuation Summary
- In comparison to the median Consumer Cyclical stock, TLYS's price/sales ratio is 42.86% lower, now standing at 0.4.
- Over the past 138 months, TLYS's EV/EBIT ratio has gone down 52.2.
Below are key valuation metrics over time for TLYS.
Stock | Date | P/S | P/B | P/E | EV/EBIT |
---|---|---|---|---|---|
TLYS | 2023-09-13 | 0.4 | 1.4 | -29.3 | -39.5 |
TLYS | 2023-09-12 | 0.4 | 1.5 | -29.9 | -39.9 |
TLYS | 2023-09-11 | 0.4 | 1.5 | -30.3 | -40.3 |
TLYS | 2023-09-08 | 0.4 | 1.5 | -30.0 | -40.0 |
TLYS | 2023-09-07 | 0.4 | 1.5 | -30.4 | -40.4 |
TLYS | 2023-09-06 | 0.4 | 1.5 | -30.6 | -40.5 |
TLYS Growth Metrics
- The 4 year cash and equivalents growth rate now stands at 23.33%.
- The 2 year cash and equivalents growth rate now stands at -7.95%.
- Its 5 year cash and equivalents growth rate is now at 23.33%.

The table below shows TLYS's growth in key financial areas (numbers in millions of US dollars).
Date | Revenue | Operating Cash Flow | Net Income to Common Stock |
---|---|---|---|
2022-09-30 | 696.419 | 5.47 | 21.839 |
2022-06-30 | 724.668 | 18.845 | 37.524 |
2022-03-31 | 758.312 | 26.572 | 54.103 |
2021-12-31 | 775.694 | 63.402 | 64.249 |
2021-09-30 | 749.125 | 64.714 | 61.062 |
2021-06-30 | 683.304 | 57.496 | 42.341 |
TLYS's Quality Factors
The “Quality” component of the POWR Ratings focuses on 31 different factors of a companies fundamentals and operational strength. Here are some key insights as we drill into the specifics of these quality attributes.- TLYS has a Quality Grade of B, ranking ahead of 80.3% of graded US stocks.
- TLYS's asset turnover comes in at 1.319 -- ranking 100th of 165 Retail stocks.
- ANF, AEO, and BBWI are the stocks whose asset turnover ratios are most correlated with TLYS.
The table below shows TLYS's key quality metrics over time.
Period | Asset Turnover | Gross Margin | ROIC |
---|---|---|---|
2021-07-31 | 1.319 | 0.334 | 0.107 |
2021-05-01 | 1.187 | 0.317 | 0.073 |
2021-01-30 | 1.025 | 0.268 | -0.004 |
2020-10-31 | 0.995 | 0.259 | -0.013 |
2020-08-01 | 1.005 | 0.264 | -0.004 |
2020-05-02 | 1.055 | 0.270 | 0.004 |
Tilly's, Inc. (TLYS) Company Bio
Tillys, Inc. retails casual clothing, footwear, and accessories for teens and young adults in the United States. The company was founded in 1982 and is headquartered in Irvine, California.
Latest TLYS News From Around the Web
Below are the latest news stories about TILLY'S INC that investors may wish to consider to help them evaluate TLYS as an investment opportunity.
Cboe Global Markets CEO resigns over undisclosed personal relationshipsEdward Tilly, the CEO of Cboe Global Markets (NYSE:CBOE), resigned from his position on Tuesday following an investigation into undisclosed personal relationships with colleagues. This investigation was initiated in late August by the board of directors and an external independent counsel. The company's shares closed 2.8% higher at $155.87 following the announcement. |
Tilly's (TLYS) Loss Narrows in Q2, Comparable Sales Decline Y/YTilly's (TLYS) Q2 results reflect a decline in comparable sales, improved gross margin and higher SG&A expenses. Nonetheless, comparable sales improve on a sequential basis. |
Tilly’s, Inc. (NYSE:TLYS) Q2 2023 Earnings Call TranscriptTilly’s, Inc. (NYSE:TLYS) Q2 2023 Earnings Call Transcript August 31, 2023 Tilly’s, Inc. beats earnings expectations. Reported EPS is $0.04, expectations were $-0.21. Operator: Hello, and welcome to Tilly’s Second Quarter 2023 Results Earnings Conference — Earnings Results Conference Call. All participants will be in a listen-only mode. [Operator Instructions] After today’s presentation there will […] |
Q2 2023 Tillys Inc Earnings CallQ2 2023 Tillys Inc Earnings Call |
Tilly's (TLYS) Q2 2023 Earnings Call TranscriptEd Thomas, president and CEO; and Michael Henry, executive vice president and CFO, will discuss the company's results and then host a Q&A session. And then, maybe just, could you talk about the -- what's contemplated in the ticket versus transaction within the comp outlook? |
TLYS Price Returns
1-mo | -6.77% |
3-mo | N/A |
6-mo | 8.41% |
1-year | 17.34% |
3-year | 30.76% |
5-year | -54.54% |
YTD | -10.28% |
2022 | -43.82% |
2021 | 97.43% |
2020 | -33.39% |
2019 | 12.80% |
2018 | -26.42% |
Continue Researching TLYS
Want to do more research on Tilly'S Inc's stock and its price? Try the links below:Tilly'S Inc (TLYS) Stock Price | Nasdaq
Tilly'S Inc (TLYS) Stock Quote, History and News - Yahoo Finance
Tilly'S Inc (TLYS) Stock Price and Basic Information | MarketWatch
Loading social stream, please wait...