
Tencent Music Entertainment Group ADR (TME): Price and Financial Metrics
TME Price/Volume Stats
| Current price | $12.00 | 52-week high | $15.77 |
| Prev. close | $12.29 | 52-week low | $9.41 |
| Day low | $11.93 | Volume | 2,421,871 |
| Day high | $12.35 | Avg. volume | 8,324,913 |
| 50-day MA | $13.18 | Dividend yield | 1.42% |
| 200-day MA | $12.22 | Market Cap | 20.59B |
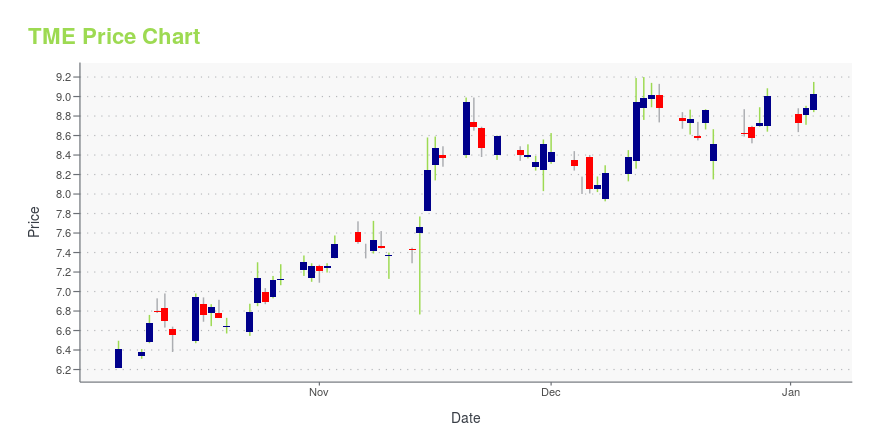
TME Stock Price Chart Interactive Chart >
Tencent Music Entertainment Group ADR (TME) Company Bio
Tencent Music Entertainment Group (Chinese: 腾讯音乐娱乐集团) is a company that develops music streaming services for the Chinese market. Tencent Music's apps include QQ Music, Kugou, Kuwo, and WeSing; which have more than 800 million active users and 120 million paying subscribers. As of July 2016, Tencent Music's three services held an estimated 56% market share of music streaming services in China. (Source:Wikipedia)
TME Price Returns
| 1-mo | -13.24% |
| 3-mo | 9.43% |
| 6-mo | 4.81% |
| 1-year | 7.87% |
| 3-year | 200.35% |
| 5-year | 10.20% |
| YTD | 7.02% |
| 2024 | 27.08% |
| 2023 | 8.82% |
| 2022 | 20.88% |
| 2021 | -64.40% |
| 2020 | 63.88% |
TME Dividends
| Ex-Dividend Date | Type | Payout Amount | Change | ||||||
|---|---|---|---|---|---|---|---|---|---|
| Loading, please wait... | |||||||||
Loading social stream, please wait...