TriNet Group, Inc. (TNET): Price and Financial Metrics
TNET Price/Volume Stats
Current price | $132.49 | 52-week high | $133.94 |
Prev. close | $132.26 | 52-week low | $76.92 |
Day low | $132.45 | Volume | 232,900 |
Day high | $133.94 | Avg. volume | 233,841 |
50-day MA | $122.32 | Dividend yield | N/A |
200-day MA | $112.54 | Market Cap | 6.70B |
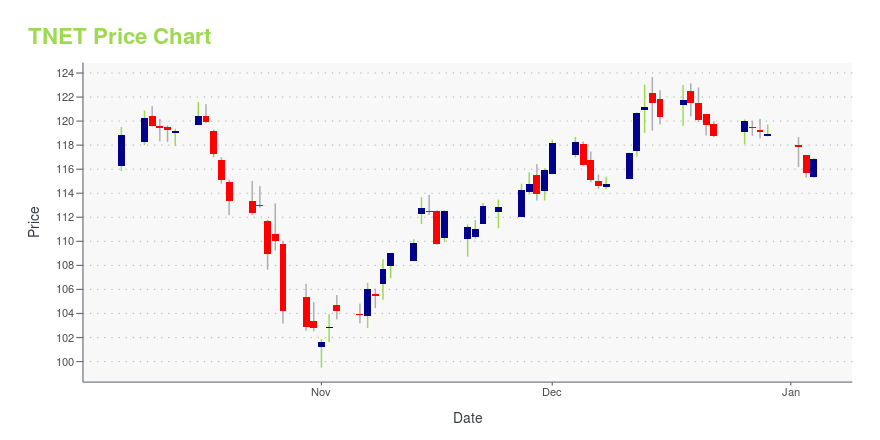
TNET Stock Price Chart Interactive Chart >
TNET POWR Grades
- Stability is the dimension where TNET ranks best; there it ranks ahead of 82.13% of US stocks.
- TNET's strongest trending metric is Value; it's been moving down over the last 26 weeks.
- TNET's current lowest rank is in the Growth metric (where it is better than 35.53% of US stocks).
TNET Stock Summary
- TRINET GROUP INC's capital turnover -- a measure of revenue relative to shareholder's equity -- is better than 99.95% of US listed stocks.
- With a year-over-year growth in debt of 105.8%, TRINET GROUP INC's debt growth rate surpasses 92.06% of about US stocks.
- TRINET GROUP INC's shareholder yield -- a measure of how much capital is returned to stockholders via dividends and buybacks -- is 11.02%, greater than the shareholder yield of 84.91% of stocks in our set.
- Stocks that are quantitatively similar to TNET, based on their financial statements, market capitalization, and price volatility, are CSBR, VVOS, RDFN, MDXG, and CAPL.
- Visit TNET's SEC page to see the company's official filings. To visit the company's web site, go to www.trinet.com.
TNET Valuation Summary
- TNET's price/sales ratio is 1.2; this is 42.86% lower than that of the median Industrials stock.
- Over the past 119 months, TNET's price/sales ratio has gone up 0.4.
Below are key valuation metrics over time for TNET.
Stock | Date | P/S | P/B | P/E | EV/EBIT |
---|---|---|---|---|---|
TNET | 2023-12-29 | 1.2 | 600.7 | 16.9 | 12.1 |
TNET | 2023-12-28 | 1.2 | 601.5 | 16.9 | 12.1 |
TNET | 2023-12-27 | 1.2 | 603.0 | 16.9 | 12.1 |
TNET | 2023-12-26 | 1.2 | 606.2 | 17.0 | 12.2 |
TNET | 2023-12-22 | 1.2 | 599.7 | 16.8 | 12.1 |
TNET | 2023-12-21 | 1.2 | 604.5 | 17.0 | 12.2 |
TNET Growth Metrics
- Its year over year revenue growth rate is now at 16.11%.
- Its year over year cash and equivalents growth rate is now at -8.22%.
- Its 5 year net income to common stockholders growth rate is now at 205.48%.
The table below shows TNET's growth in key financial areas (numbers in millions of US dollars).
Date | Revenue | Operating Cash Flow | Net Income to Common Stock |
---|---|---|---|
2022-12-31 | 4,885 | 562 | 355 |
2022-09-30 | 4,891 | 310 | 377 |
2022-06-30 | 4,798 | 533 | 377 |
2022-03-31 | 4,698 | 607 | 383 |
2021-12-31 | 4,540 | 218 | 338 |
2021-09-30 | 4,371 | 570 | 291 |
TNET's Quality Factors
The “Quality” component of the POWR Ratings focuses on 31 different factors of a companies fundamentals and operational strength. Here are some key insights as we drill into the specifics of these quality attributes.- TNET has a Quality Grade of B, ranking ahead of 83.65% of graded US stocks.
- TNET's asset turnover comes in at 1.446 -- ranking 59th of 561 Business Services stocks.
- SABR, MA, and CSGP are the stocks whose asset turnover ratios are most correlated with TNET.
The table below shows TNET's key quality metrics over time.
Period | Asset Turnover | Gross Margin | ROIC |
---|---|---|---|
2021-09-30 | 1.446 | 0.199 | 15.573 |
2021-06-30 | 1.412 | 0.186 | 15.281 |
2021-03-31 | 1.381 | 0.202 | 39.300 |
2020-12-31 | 1.406 | 0.197 | 6.121 |
2020-09-30 | 1.427 | 0.203 | 3.261 |
2020-06-30 | 1.509 | 0.207 | 2.183 |
TriNet Group, Inc. (TNET) Company Bio
TriNet Group provides human resources solutions for small and medium-sized businesses in the United States and Canada. The company offers payroll processing, human capital consulting, and employment law compliance services, as well as health insurance, retirement plans, and workers compensation insurance services. The company was founded in 1988 and is founded in San Leandro, California.
Latest TNET News From Around the Web
Below are the latest news stories about TRINET GROUP INC that investors may wish to consider to help them evaluate TNET as an investment opportunity.
TriNet Named One of America's Greatest Workplaces for Diversity by NewsweekTriNet (NYSE: TNET), a leading provider of comprehensive human resources solutions for small and medium-size businesses (SMBs), has been recognized as one of America's Greatest Workplaces for Diversity by Newsweek, earning the highest rating of five stars on the list of mid-size companies nationwide. |
TriNet Launches New Website That Provides Small and Medium-Size Businesses with Powerful HR SolutionsTriNet (NYSE: TNET), a leading provider of comprehensive human resources solutions for small and medium-size businesses (SMBs), today introduced its redesigned website, combining the full force of its all-in-one HR capabilities into one modernized, engaging and user-friendly site. The launch of this new site is a key component of TriNet's continued promise to businesses to provide incredible HR products and services that can scale and evolve with their needs. |
TriNet Earns 95 in Human Rights Campaign Foundation's 2023-2024 Corporate Equality IndexTriNet (NYSE: TNET), a leading provider of comprehensive human resources solutions for small and medium-size businesses (SMBs),, has received a score of 95 out of 100 on the Human Rights Campaign Foundation's 2023-2024 Corporate Equality Index, the nation's foremost benchmarking survey and report measuring corporate policies and practices related to LGBTQ+ workplace equality. TriNet joins the ranks of 1384 major U.S. businesses that were also ranked in the 2023-2024 CEI. |
TriNet Releases 2023 Environmental, Social and Governance ReportTriNet (NYSE: TNET), a leading provider of comprehensive human resources solutions for small and medium-size businesses (SMBs), today announced the release of its 2023 TriNet Environmental, Social and Governance (ESG) report. The report details the central role ESG plays in TriNet's operations. |
At US$106, Is TriNet Group, Inc. (NYSE:TNET) Worth Looking At Closely?TriNet Group, Inc. ( NYSE:TNET ), is not the largest company out there, but it received a lot of attention from a... |
TNET Price Returns
1-mo | 3.57% |
3-mo | 11.61% |
6-mo | 13.96% |
1-year | 68.39% |
3-year | 71.30% |
5-year | 122.20% |
YTD | 11.61% |
2023 | 75.41% |
2022 | -28.83% |
2021 | 18.19% |
2020 | 42.38% |
2019 | 34.95% |
Continue Researching TNET
Want to see what other sources are saying about Trinet Group Inc's financials and stock price? Try the links below:Trinet Group Inc (TNET) Stock Price | Nasdaq
Trinet Group Inc (TNET) Stock Quote, History and News - Yahoo Finance
Trinet Group Inc (TNET) Stock Price and Basic Information | MarketWatch
Loading social stream, please wait...