Tenaya Therapeutics, Inc. (TNYA): Price and Financial Metrics
TNYA Price/Volume Stats
| Current price | $0.45 | 52-week high | $4.67 |
| Prev. close | $0.44 | 52-week low | $0.36 |
| Day low | $0.42 | Volume | 2,201,000 |
| Day high | $0.45 | Avg. volume | 2,989,340 |
| 50-day MA | $0.52 | Dividend yield | N/A |
| 200-day MA | $1.63 | Market Cap | 73.14M |
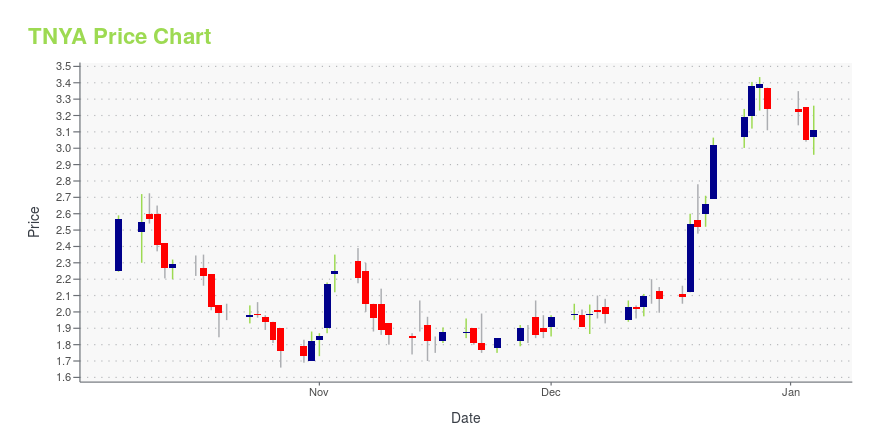
TNYA Stock Price Chart Interactive Chart >
Tenaya Therapeutics, Inc. (TNYA) Company Bio
Tenaya Therapeutics, Inc. develops therapeutics for heart failure. It offers cellular regeneration platform, that enables in vivo reprogramming of cardiac fibroblasts into cardio myocytes by delivering proprietary transcription factors; gene therapy platform, that enables the targeted delivery of a payload to cardiac fibroblasts; and precision medicine platform, which provides personalized medicine approach to treat heart disease. The company was incorporated in 2016 and is based in South San Francisco, California.
TNYA Price Returns
| 1-mo | N/A |
| 3-mo | -60.53% |
| 6-mo | -79.73% |
| 1-year | -90.34% |
| 3-year | -93.23% |
| 5-year | N/A |
| YTD | -68.53% |
| 2024 | -55.86% |
| 2023 | 61.19% |
| 2022 | -89.39% |
| 2021 | N/A |
| 2020 | N/A |


Loading social stream, please wait...