Turning Point Brands, Inc. (TPB): Price and Financial Metrics
TPB Price/Volume Stats
Current price | $24.25 | 52-week high | $26.31 |
Prev. close | $24.26 | 52-week low | $18.96 |
Day low | $23.90 | Volume | 74,300 |
Day high | $24.34 | Avg. volume | 148,458 |
50-day MA | $22.21 | Dividend yield | 1.09% |
200-day MA | $22.89 | Market Cap | 426.92M |
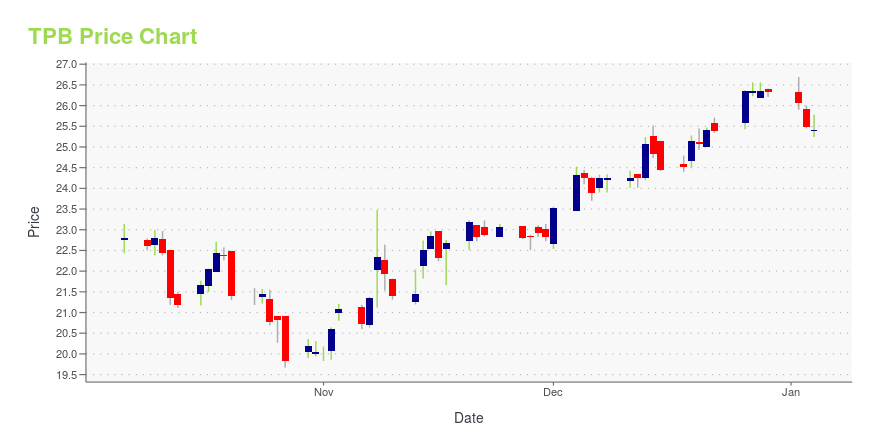
TPB Stock Price Chart Interactive Chart >
TPB POWR Grades
- Sentiment is the dimension where TPB ranks best; there it ranks ahead of 78.5% of US stocks.
- TPB's strongest trending metric is Stability; it's been moving up over the last 177 days.
- TPB's current lowest rank is in the Stability metric (where it is better than 60.01% of US stocks).
TPB Stock Summary
- TURNING POINT BRANDS INC's capital turnover -- a measure of revenue relative to shareholder's equity -- is better than 82.05% of US listed stocks.
- The volatility of TURNING POINT BRANDS INC's share price is greater than that of only 15.02% US stocks with at least 200 days of trading history.
- TURNING POINT BRANDS INC's shareholder yield -- a measure of how much capital is returned to stockholders via dividends and buybacks -- is 14.09%, greater than the shareholder yield of 87.13% of stocks in our set.
- Stocks with similar financial metrics, market capitalization, and price volatility to TURNING POINT BRANDS INC are POST, SPLP, EEFT, UONE, and SF.
- Visit TPB's SEC page to see the company's official filings. To visit the company's web site, go to www.turningpointbrands.com.
TPB Valuation Summary
- In comparison to the median Consumer Defensive stock, TPB's price/sales ratio is 41.18% lower, now standing at 1.
- TPB's price/earnings ratio has moved up 14.2 over the prior 92 months.
Below are key valuation metrics over time for TPB.
Stock | Date | P/S | P/B | P/E | EV/EBIT |
---|---|---|---|---|---|
TPB | 2023-11-30 | 1 | 2.9 | 33.4 | 19.9 |
TPB | 2023-11-29 | 1 | 2.9 | 33.5 | 20.0 |
TPB | 2023-11-28 | 1 | 2.9 | 33.4 | 19.9 |
TPB | 2023-11-27 | 1 | 2.9 | 33.3 | 19.9 |
TPB | 2023-11-24 | 1 | 2.9 | 33.7 | 20.1 |
TPB | 2023-11-22 | 1 | 2.9 | 33.5 | 20.0 |
TPB Growth Metrics
- Its 5 year cash and equivalents growth rate is now at 4321.98%.
- The year over year net income to common stockholders growth rate now stands at 23.41%.
- Its 3 year cash and equivalents growth rate is now at 7139.8%.

The table below shows TPB's growth in key financial areas (numbers in millions of US dollars).
Date | Revenue | Operating Cash Flow | Net Income to Common Stock |
---|---|---|---|
2022-09-30 | 416.904 | 35.041 | 39.412 |
2022-06-30 | 419.006 | 37.951 | 41.344 |
2022-03-31 | 438.724 | 57.016 | 51.274 |
2021-12-31 | 445.471 | 68.217 | 52.059 |
2021-09-30 | 445.473 | 60.044 | 53.348 |
2021-06-30 | 439.743 | 63.559 | 47.676 |
TPB's Quality Factors
The “Quality” component of the POWR Ratings focuses on 31 different factors of a companies fundamentals and operational strength. Here are some key insights as we drill into the specifics of these quality attributes.- TPB has a Quality Grade of C, ranking ahead of 59.13% of graded US stocks.
- TPB's asset turnover comes in at 0.752 -- ranking 3rd of 5 Tobacco Products stocks.
- XXII, MO, and VGR are the stocks whose asset turnover ratios are most correlated with TPB.
The table below shows TPB's key quality metrics over time.
Period | Asset Turnover | Gross Margin | ROIC |
---|---|---|---|
2021-09-30 | 0.752 | 0.492 | 0.155 |
2021-06-30 | 0.790 | 0.485 | 0.153 |
2021-03-31 | 0.818 | 0.477 | 0.152 |
2020-12-31 | 0.860 | 0.468 | 0.148 |
2020-09-30 | 0.825 | 0.395 | 0.073 |
2020-06-30 | 0.820 | 0.388 | 0.066 |
TPB Price Target
For more insight on analysts targets of TPB, see our TPB price target page. And for a list of of all stocks sorted by upside potential based on analyst target price, see our Top Price Target page.
Average Price Target | $52.00 | Average Broker Recommendation | 1.4 (Strong Buy) |
Turning Point Brands, Inc. (TPB) Company Bio
Turning Point Brands, Inc., through its subsidiaries, manufactures and markets smokeless and smoking tobacco products in the United States. The company operates in three segments: Smokeless Products; Smoking Products; and New Generation Products. The company was founded in 2004 and is based in Louisville, Kentucky.
Latest TPB News From Around the Web
Below are the latest news stories about TURNING POINT BRANDS INC that investors may wish to consider to help them evaluate TPB as an investment opportunity.
Turning Point Brands' (NYSE:TPB) Dividend Will Be $0.065The board of Turning Point Brands, Inc. ( NYSE:TPB ) has announced that it will pay a dividend of $0.065 per share on... |
Kaival Brands Appoints James W. Dobbins as Senior Vice President, General CounselFormer Turning Point Brands (NYSE: TPB) General Counsel brings more than three decades of corporate counsel experience focused on nicotine, cannabis, and adjacent consumer categoriesGRANT-VALKARIA, Fla., Dec. 07, 2023 (GLOBE NEWSWIRE) -- Kaival Brands Innovations Group, Inc. (NASDAQ: KAVL) ("Kaival Brands," the "Company," or "we"), today announced that it has appointed James W. Dobbins as General Counsel effective December 5, 2023. Barry Hopkins, Executive Chairman of Kaival Brands, said, “James |
Read This Before Judging Turning Point Brands, Inc.'s (NYSE:TPB) ROEWhile some investors are already well versed in financial metrics (hat tip), this article is for those who would like... |
Turning Point Brands, Inc. (NYSE:TPB) Q3 2023 Earnings Call TranscriptTurning Point Brands, Inc. (NYSE:TPB) Q3 2023 Earnings Call Transcript November 8, 2023 Turning Point Brands, Inc. beats earnings expectations. Reported EPS is $0.76, expectations were $0.56. Operator: Good morning, and welcome to the Turning Point Brands’ Third Quarter 2023 Earnings Conference Call. [Operator Instructions] Please note, this event is being recorded. I will now […] |
Turning Point Brands Announces Third Quarter 2023 Results and Closing of New ABL FacilityLOUISVILLE, Ky., November 08, 2023--Turning Point Brands, Inc. ("TPB" or "the Company") (NYSE: TPB), a manufacturer, marketer and distributor of branded consumer products, including alternative smoking accessories and consumables with active ingredients, announced today financial results for the third quarter ended September 30, 2023. |
TPB Price Returns
1-mo | 10.58% |
3-mo | 4.13% |
6-mo | 6.16% |
1-year | 14.96% |
3-year | -41.66% |
5-year | -12.68% |
YTD | 13.09% |
2022 | -42.19% |
2021 | -14.79% |
2020 | 57.08% |
2019 | 5.63% |
2018 | 29.57% |
TPB Dividends
Ex-Dividend Date | Type | Payout Amount | Change | ||||||
---|---|---|---|---|---|---|---|---|---|
Loading, please wait... |
Continue Researching TPB
Want to see what other sources are saying about Turning Point Brands Inc's financials and stock price? Try the links below:Turning Point Brands Inc (TPB) Stock Price | Nasdaq
Turning Point Brands Inc (TPB) Stock Quote, History and News - Yahoo Finance
Turning Point Brands Inc (TPB) Stock Price and Basic Information | MarketWatch
Loading social stream, please wait...