Tejon Ranch Co (TRC): Price and Financial Metrics
TRC Price/Volume Stats
Current price | $16.03 | 52-week high | $20.65 |
Prev. close | $16.31 | 52-week low | $14.31 |
Day low | $16.03 | Volume | 23,500 |
Day high | $16.40 | Avg. volume | 38,141 |
50-day MA | $17.00 | Dividend yield | N/A |
200-day MA | $17.96 | Market Cap | 428.42M |
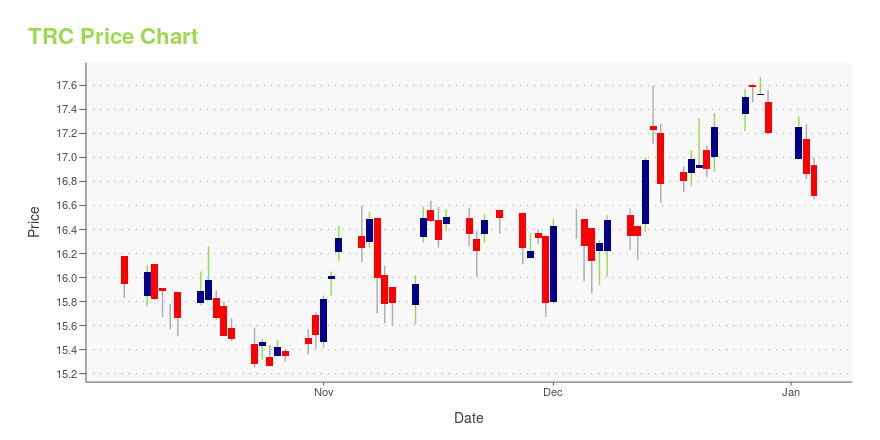
TRC Stock Price Chart Interactive Chart >
TRC POWR Grades
- TRC scores best on the Sentiment dimension, with a Sentiment rank ahead of 81.57% of US stocks.
- The strongest trend for TRC is in Quality, which has been heading down over the past 179 days.
- TRC's current lowest rank is in the Quality metric (where it is better than 11.57% of US stocks).
TRC Stock Summary
- The price/operating cash flow metric for TEJON RANCH CO is higher than 95.28% of stocks in our set with a positive cash flow.
- Of note is the ratio of TEJON RANCH CO's sales and general administrative expense to its total operating expenses; 87.22% of US stocks have a lower such ratio.
- The volatility of TEJON RANCH CO's share price is greater than that of only 13.38% US stocks with at least 200 days of trading history.
- Stocks that are quantitatively similar to TRC, based on their financial statements, market capitalization, and price volatility, are MC, WRBY, AIRS, STEP, and ALHC.
- Visit TRC's SEC page to see the company's official filings. To visit the company's web site, go to tejonranch.com.
TRC Valuation Summary
- In comparison to the median Industrials stock, TRC's price/earnings ratio is 75.81% higher, now standing at 32.7.
- Over the past 243 months, TRC's EV/EBIT ratio has gone up 1110.
Below are key valuation metrics over time for TRC.
Stock | Date | P/S | P/B | P/E | EV/EBIT |
---|---|---|---|---|---|
TRC | 2023-09-15 | 6.9 | 1.0 | 32.7 | 24.3 |
TRC | 2023-09-14 | 6.8 | 1.0 | 32.0 | 23.9 |
TRC | 2023-09-13 | 6.6 | 1.0 | 31.1 | 23.2 |
TRC | 2023-09-12 | 6.6 | 1.0 | 31.3 | 23.4 |
TRC | 2023-09-11 | 6.5 | 0.9 | 31.0 | 23.1 |
TRC | 2023-09-08 | 6.6 | 1.0 | 31.2 | 23.3 |
TRC Growth Metrics
- Its 4 year net income to common stockholders growth rate is now at 483.04%.
- Its 2 year cash and equivalents growth rate is now at 46.54%.
- The 2 year net cashflow from operations growth rate now stands at -66.72%.

The table below shows TRC's growth in key financial areas (numbers in millions of US dollars).
Date | Revenue | Operating Cash Flow | Net Income to Common Stock |
---|---|---|---|
2022-09-30 | 74.723 | 6.6 | 17.186 |
2022-06-30 | 58.21 | 6.569 | 7.221 |
2022-03-31 | 65.579 | 7.086 | 10.71 |
2021-12-31 | 55.613 | 2.816 | 5.348 |
2021-09-30 | 51.883 | 5.977 | 1.863 |
2021-06-30 | 50.434 | 14.335 | 2.042 |
TRC's Quality Factors
The “Quality” component of the POWR Ratings focuses on 31 different factors of a companies fundamentals and operational strength. Here are some key insights as we drill into the specifics of these quality attributes.- TRC has a Quality Grade of F, ranking ahead of 4.88% of graded US stocks.
- TRC's asset turnover comes in at 0.096 -- ranking 40th of 63 Real Estate stocks.
- BVH, EFC, and MLP are the stocks whose asset turnover ratios are most correlated with TRC.
The table below shows TRC's key quality metrics over time.
Period | Asset Turnover | Gross Margin | ROIC |
---|---|---|---|
2021-09-30 | 0.096 | 0.151 | 0.005 |
2021-06-30 | 0.094 | 0.165 | 0.006 |
2021-03-31 | 0.072 | 0.082 | -0.001 |
2020-12-31 | 0.071 | 0.071 | 0.000 |
2020-09-30 | 0.091 | 0.165 | 0.025 |
2020-06-30 | 0.084 | 0.135 | 0.023 |
Tejon Ranch Co (TRC) Company Bio
Tejon Ranch operates as a diversified real estate development and agribusiness company. The company operates through four segments: Commercial/Industrial Real Estate Development, Resort/Residential Real Estate Development, Mineral Resources, and Farming. The company was founded in 1936 and is based in Lebec, California.
Latest TRC News From Around the Web
Below are the latest news stories about TEJON RANCH CO that investors may wish to consider to help them evaluate TRC as an investment opportunity.
Tejon Ranch Co. Announces Second Quarter 2023 Financial ResultsTEJON RANCH, Calif., Aug. 03, 2023 (GLOBE NEWSWIRE) -- Tejon Ranch Co., or the Company, (NYSE:TRC), a diversified real estate development and agribusiness company, today announced financial results for the three- and six-months ended June 30, 2023. "We made progress in several areas of our business this quarter, including higher revenues in our commercial/industrial operations. By driving costs lower, we improved net income and Adjusted EBITDA compared with last year’s second quarter. Furthermor |
Tejon Ranch Co. Names New General CounselTEJON RANCH, Calif., July 10, 2023 (GLOBE NEWSWIRE) -- Tejon Ranch Co. (NYSE: TRC) announced today the reappointment of Michael R.W. Houston as Senior Vice President, General Counsel and Corporate Secretary. Houston previously held those positions at the Company for almost five years beginning in 2016. He left Tejon Ranch in 2021 to join the Southern California Association of Governments, where he served as Chief Counsel and Director of Legal Services for the nation’s largest metropolitan planni |
12 Best Land and Timber Stocks To BuyIn this article, we discuss 12 best land and timber stocks to buy. If you want to see more stocks in this selection, check out 5 Best Land and Timber Stocks To Buy. Horizon Kinetics is an investment adviser managed by Murray Stahl that focuses on discovering investment prospects that are often overlooked or undervalued […] |
The past five years for Tejon Ranch (NYSE:TRC) investors has not been profitableFor many, the main point of investing is to generate higher returns than the overall market. But in any portfolio... |
Should You Invest in Tejon Ranch Co. (TRC)?Horizon Kinetics LLC, an investment management company, released its first quarter 2023 investor letter. A copy of the same can be downloaded here. The letter discussed certain business models that can be valuable long-term components of a portfolio. You can check the fund’s top 5 holdings to know more about its best picks for 2023. […] |
TRC Price Returns
1-mo | -3.08% |
3-mo | -5.54% |
6-mo | -12.21% |
1-year | 6.16% |
3-year | 18.57% |
5-year | -27.10% |
YTD | -14.92% |
2022 | -1.26% |
2021 | 32.04% |
2020 | -9.57% |
2019 | -3.62% |
2018 | -20.13% |
Continue Researching TRC
Here are a few links from around the web to help you further your research on Tejon Ranch Co's stock as an investment opportunity:Tejon Ranch Co (TRC) Stock Price | Nasdaq
Tejon Ranch Co (TRC) Stock Quote, History and News - Yahoo Finance
Tejon Ranch Co (TRC) Stock Price and Basic Information | MarketWatch
Loading social stream, please wait...