United States Antimony Corporation (UAMY): Price and Financial Metrics
GET POWR RATINGS... FREE!
UAMY POWR Grades
- Momentum is the dimension where UAMY ranks best; there it ranks ahead of 91.12% of US stocks.
- UAMY's strongest trending metric is Growth; it's been moving up over the last 105 days.
- UAMY's current lowest rank is in the Stability metric (where it is better than 4.38% of US stocks).
UAMY Stock Summary
- For UAMY, its debt to operating expenses ratio is greater than that reported by merely 0.5% of US equities we're observing.
- UAMY's equity multiplier -- a measure of assets relative to shareholders'equity -- is greater than that of only 10.39% of US stocks.
- With a year-over-year growth in debt of -100%, United States Antimony Corp's debt growth rate surpasses only 0% of about US stocks.
- Stocks with similar financial metrics, market capitalization, and price volatility to United States Antimony Corp are TDW, POAI, AMPY, PUMP, and KEX.
- UAMY's SEC filings can be seen here. And to visit United States Antimony Corp's official web site, go to www.usantimony.com.
UAMY Valuation Summary
- UAMY's price/sales ratio is 18.4; this is 1050% higher than that of the median Basic Materials stock.
- UAMY's price/sales ratio has moved up 17.8 over the prior 243 months.
- UAMY's price/earnings ratio has moved down 33.9 over the prior 243 months.
Below are key valuation metrics over time for UAMY.
Stock | Date | P/S | P/B | P/E | EV/EBIT |
---|---|---|---|---|---|
UAMY | 2021-09-03 | 18.4 | 3.1 | -36.4 | -28.9 |
UAMY | 2021-09-02 | 18.7 | 3.1 | -37.0 | -29.5 |
UAMY | 2021-09-01 | 18.8 | 3.2 | -37.2 | -29.7 |
UAMY | 2021-08-31 | 18.4 | 3.1 | -36.4 | -28.8 |
UAMY | 2021-08-30 | 18.6 | 3.1 | -36.8 | -29.2 |
UAMY | 2021-08-27 | 17.9 | 3.0 | -35.4 | -27.9 |
UAMY Growth Metrics
- Its 2 year price growth rate is now at 21.53%.
- The year over year revenue growth rate now stands at -37.18%.
- The year over year price growth rate now stands at 112%.

The table below shows UAMY's growth in key financial areas (numbers in millions of US dollars).
Date | Revenue | Operating Cash Flow | Net Income to Common Stock |
---|---|---|---|
2021-09-30 | 6.480679 | -3.216941 | -1.856626 |
2021-06-30 | 5.436197 | -3.262339 | -2.750634 |
2021-03-31 | 4.745826 | -3.719253 | -3.362058 |
2020-12-31 | 5.23553 | -1.305664 | -3.335453 |
2020-09-30 | 6.086836 | -0.288756 | -3.535853 |
2020-06-30 | 6.867539 | -0.130658 | -3.111205 |
UAMY's Quality Factors
The “Quality” component of the POWR Ratings focuses on 31 different factors of a companies fundamentals and operational strength. Here are some key insights as we drill into the specifics of these quality attributes.- UAMY has a Quality Grade of D, ranking ahead of 24.25% of graded US stocks.
- UAMY's asset turnover comes in at 0.222 -- ranking 39th of 40 Steel Works Etc stocks.
- NX, SPLP, and IIIN are the stocks whose asset turnover ratios are most correlated with UAMY.
The table below shows UAMY's key quality metrics over time.
Period | Asset Turnover | Gross Margin | ROIC |
---|---|---|---|
2021-06-30 | 0.222 | 0.097 | -0.280 |
2021-03-31 | 0.247 | 0.067 | -0.345 |
2020-12-31 | 0.386 | 0.039 | -0.346 |
2020-09-30 | 0.446 | -0.107 | -0.353 |
2020-06-30 | 0.478 | -0.071 | -0.274 |
2020-03-31 | 0.494 | -0.086 | -0.265 |
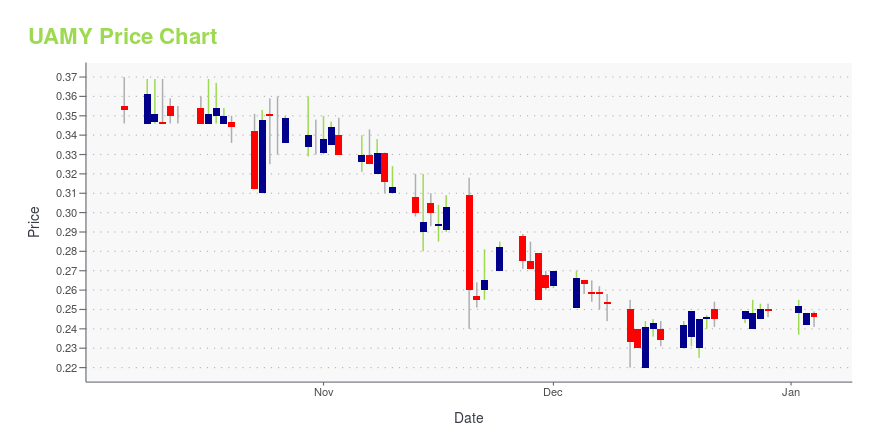
UAMY Stock Price Chart Interactive Chart >
UAMY Price/Volume Stats
Current price | $0.43 | 52-week high | $1.15 |
Prev. close | $0.43 | 52-week low | $0.34 |
Day low | $0.40 | Volume | 108,090 |
Day high | $0.44 | Avg. volume | 813,364 |
50-day MA | $0.48 | Dividend yield | N/A |
200-day MA | $0.64 | Market Cap | 45.26M |
Latest UAMY News From Around the Web
Below are the latest news stories about United States Antimony Corp that investors may wish to consider to help them evaluate UAMY as an investment opportunity.
10 Best Clean Energy Penny Stocks To Buy NowIn this article, we discuss the 10 best clean energy penny stocks to buy now. If you want to skip our detailed analysis of these stocks, go directly to the 5 Best Clean Energy Penny Stocks To Buy Now. Renewables have been increasing their overall share in new power capacity expansion across the globe over […] |
U. S. Antimony Corporation Sets Zeolite Sales Records, Continues Company-wide Process Upgrades Program - Provides Operations UpdateTHOMPSON FALLS, MT / ACCESSWIRE / January 12, 2022 / United States Antimony Corporation (USAC - the Company) is pleased to announce that December zeolite shipments from its Bear River Zeolite facility (BRZ, website Bear River Zeolite) totaled 1,837 tons ($482,683) bringing the 2021 annual total to 14,040 tons and $3,027,259.The Company is pleased to see that the implemented improvements are starting to yield increases in production and profit. |
United States Antimony Corporation (UAMY)s -4.00% Fall Drives It Into Interest-Losing Territory For InvestorsUnited States Antimony Corporation (AMEX:UAMY) has a beta value of 0.85 and has seen 1.15 million shares traded in the last trading session. The company, currently valued at $69.24M, closed the last trade at $0.63 per share which meant it lost -$0.02 on the day or -4.00% during that session. The UAMY stock price is United States Antimony Corporation (UAMY)s -4.00% Fall Drives It Into Interest-Losing Territory For Investors Read More » |
Analysts Predict An United States Antimony Corporation (AMEX: UAMY) Spike?United States Antimony Corporation (AMEX:UAMY) shares, rose in value on Wednesday, 11/24/21, with the stock price up by 9.20% to the previous days close as strong demand from buyers drove the stock to $0.70. Actively observing the price movement in the last trading, the stock closed the session at $0.64, falling within a range of Analysts Predict An United States Antimony Corporation (AMEX: UAMY) Spike? Read More » |
Corporate Update from US Antimony CorporationA United States Antimony Corporation (NYSE:UAMY Provides Corporate Update for November 2021)THOMPSON FALLS, MT / ACCESSWIRE / November 23, 2021 / The update is intended to highlight the corporate objectives and to provide information on the progress being made towards achieving these goals. Sales and financial information will continue to be announced quarterly through the Company's 10Q filing and material information will be announced separately. |
UAMY Price Returns
1-mo | -7.25% |
3-mo | -1.38% |
6-mo | N/A |
1-year | -46.41% |
3-year | -24.56% |
5-year | -2.27% |
YTD | -13.62% |
2021 | -4.64% |
2020 | 35.58% |
2019 | -33.62% |
2018 | 81.25% |
2017 | 28.00% |
Continue Researching UAMY
Want to see what other sources are saying about United States Antimony Corp's financials and stock price? Try the links below:United States Antimony Corp (UAMY) Stock Price | Nasdaq
United States Antimony Corp (UAMY) Stock Quote, History and News - Yahoo Finance
United States Antimony Corp (UAMY) Stock Price and Basic Information | MarketWatch
Loading social stream, please wait...