Uranium Energy Corp. (UEC): Price and Financial Metrics
GET POWR RATINGS... FREE!
UEC POWR Grades
- Sentiment is the dimension where UEC ranks best; there it ranks ahead of 63.88% of US stocks.
- UEC's strongest trending metric is Growth; it's been moving up over the last 177 days.
- UEC's current lowest rank is in the Stability metric (where it is better than 0.08% of US stocks).
UEC Stock Summary
- For UEC, its debt to operating expenses ratio is greater than that reported by just 0.44% of US equities we're observing.
- Over the past twelve months, UEC has reported earnings growth of -273.76%, putting it ahead of merely 5.78% of US stocks in our set.
- As for revenue growth, note that UEC's revenue has grown 773.27% over the past 12 months; that beats the revenue growth of 98.83% of US companies in our set.
- If you're looking for stocks that are quantitatively similar to URANIUM ENERGY CORP, a group of peers worth examining would be PLSE, MRAM, AUDC, HYPR, and PROF.
- Visit UEC's SEC page to see the company's official filings. To visit the company's web site, go to www.uraniumenergy.com.
UEC Valuation Summary
- UEC's price/sales ratio is 8.9; this is 641.67% higher than that of the median Basic Materials stock.
- Over the past 139 months, UEC's EV/EBIT ratio has gone up 58.1.
Below are key valuation metrics over time for UEC.
Stock | Date | P/S | P/B | P/E | EV/EBIT |
---|---|---|---|---|---|
UEC | 2023-03-24 | 8.9 | 1.6 | 51.4 | 48.5 |
UEC | 2023-03-23 | 8.9 | 1.6 | 51.2 | 48.3 |
UEC | 2023-03-22 | 10.4 | 1.9 | 60.1 | 57.0 |
UEC | 2023-03-21 | 10.9 | 2.0 | 62.7 | 59.6 |
UEC | 2023-03-20 | 10.6 | 2.0 | 61.2 | 58.1 |
UEC | 2023-03-17 | 10.7 | 2.0 | 61.9 | 58.9 |
UEC Growth Metrics
- Its 4 year cash and equivalents growth rate is now at -0.92%.
- Its 5 year price growth rate is now at -28.08%.
- Its 2 year price growth rate is now at 209.52%.

The table below shows UEC's growth in key financial areas (numbers in millions of US dollars).
Date | Revenue | Operating Cash Flow | Net Income to Common Stock |
---|---|---|---|
2022-09-30 | 80.453 | -4.172722 | 3.569826 |
2022-06-30 | 23.161 | -52.987 | 5.252 |
2022-03-31 | 23.08323 | -43.25774 | -2.002408 |
2021-12-31 | 13.19093 | -53.5787 | -13.93731 |
2021-09-30 | 0 | -51.17761 | -11.9241 |
2021-06-30 | 0 | -41.46945 | -14.81381 |
UEC's Quality Factors
The “Quality” component of the POWR Ratings focuses on 31 different factors of a companies fundamentals and operational strength. Here are some key insights as we drill into the specifics of these quality attributes.- UEC has a Quality Grade of F, ranking ahead of 1.34% of graded US stocks.
- UEC's asset turnover comes in at 0 -- ranking 31st of 42 Non-Metallic and Industrial Metal Mining stocks.
- OPNT, PLM, and TRQ are the stocks whose asset turnover ratios are most correlated with UEC.
The table below shows UEC's key quality metrics over time.
Period | Asset Turnover | Gross Margin | ROIC |
---|---|---|---|
2021-04-30 | 0 | NA | -0.136 |
2021-01-31 | 0 | NA | -0.126 |
2020-10-31 | 0 | NA | -0.106 |
2020-07-31 | 0 | NA | -0.110 |
2020-04-30 | 0 | NA | -0.127 |
2020-01-31 | 0 | NA | -0.140 |
UEC Stock Price Chart Interactive Chart >
UEC Price/Volume Stats
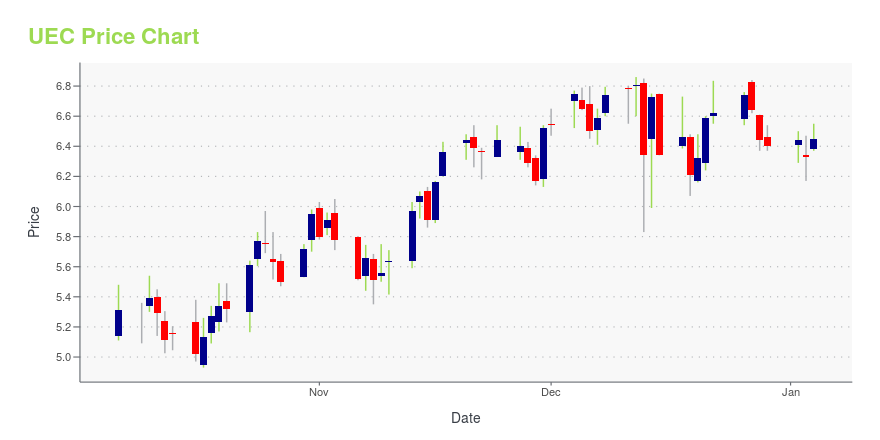
Current price | $2.88 | 52-week high | $6.60 |
Prev. close | $2.90 | 52-week low | $2.36 |
Day low | $2.86 | Volume | 4,631,000 |
Day high | $2.97 | Avg. volume | 8,135,918 |
50-day MA | $3.57 | Dividend yield | N/A |
200-day MA | $3.73 | Market Cap | 1.08B |
Uranium Energy Corp. (UEC) Company Bio
Uranium Energy Corp. engages in the exploration, pre-extraction, extraction, and processing of uranium concentrates on projects located in the United States and the Republic of Paraguay. The company was founded in 2003 and is based in Corpus Christi, Texas.
Latest UEC News From Around the Web
Below are the latest news stories about URANIUM ENERGY CORP that investors may wish to consider to help them evaluate UEC as an investment opportunity.
After Plunging -23.24% in 4 Weeks, Here's Why the Trend Might Reverse for Uranium Energy (UEC)Uranium Energy (UEC) has become technically an oversold stock now, which implies exhaustion of the heavy selling pressure on it. This, combined with strong agreement among Wall Street analysts in revising earnings estimates higher, indicates a potential trend reversal for the stock in the near term. |
Uranium Energy Corp Announces Re-Election of Executive Vice President - Scott Melbye as President of the Uranium Producers of AmericaUranium Energy Corp (NYSE American: UEC) ("UEC" or the "Company") is pleased to announce that Scott Melbye, UEC's Executive Vice President, has been re-elected to serve another term as President of the Uranium Producers of America ("UPA"). |
Uranium Energy (UEC) Loses -22.95% in 4 Weeks, Here's Why a Trend Reversal May be Around the CornerUranium Energy (UEC) is technically in oversold territory now, so the heavy selling pressure might have exhausted. This along with strong agreement among Wall Street analysts in raising earnings estimates could lead to a trend reversal for the stock. |
Here's Why Uranium Energy (UEC) is Poised for a Turnaround After Losing -22.88% in 4 WeeksUranium Energy (UEC) has become technically an oversold stock now, which implies exhaustion of the heavy selling pressure on it. This, combined with strong agreement among Wall Street analysts in revising earnings estimates higher, indicates a potential trend reversal for the stock in the near term. |
Today’s Biggest Pre-Market Stock Movers: 10 Top Gainers and Losers on FridayIt's time to start off the day with a breakdown of the biggest pre-market stock movers traders need to know about for Friday! |
UEC Price Returns
1-mo | -20.66% |
3-mo | -25.77% |
6-mo | -24.61% |
1-year | -38.46% |
3-year | 407.04% |
5-year | 125.00% |
YTD | -25.77% |
2022 | 15.82% |
2021 | 90.34% |
2020 | 91.47% |
2019 | -26.46% |
2018 | -29.38% |
Loading social stream, please wait...