UFP Technologies, Inc. (UFPT): Price and Financial Metrics
GET POWR RATINGS... FREE!
UFPT Price/Volume Stats
Current price | $155.25 | 52-week high | $157.96 |
Prev. close | $151.63 | 52-week low | $71.83 |
Day low | $151.38 | Volume | 50,800 |
Day high | $155.65 | Avg. volume | 77,201 |
50-day MA | $137.49 | Dividend yield | N/A |
200-day MA | $113.79 | Market Cap | 1.18B |
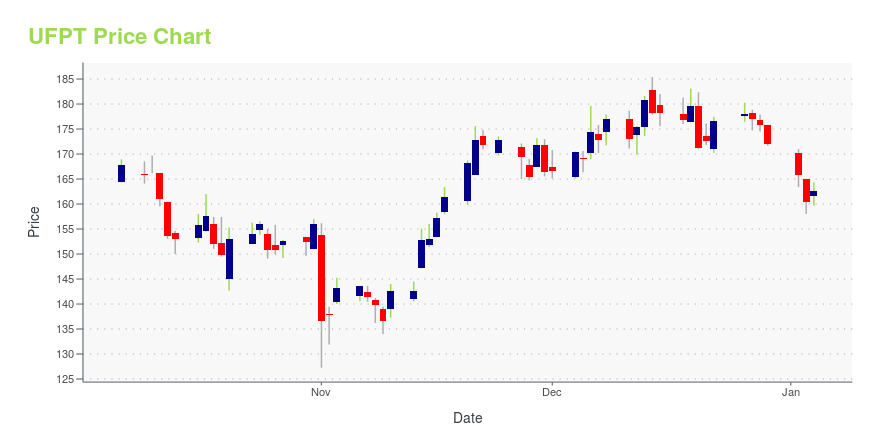
UFPT Stock Price Chart Interactive Chart >
UFPT POWR Grades
- UFPT scores best on the Growth dimension, with a Growth rank ahead of 93.63% of US stocks.
- UFPT's strongest trending metric is Value; it's been moving up over the last 179 days.
- UFPT ranks lowest in Value; there it ranks in the 0th percentile.
UFPT Stock Summary
- The price/operating cash flow metric for UFP TECHNOLOGIES INC is higher than 92.49% of stocks in our set with a positive cash flow.
- Of note is the ratio of UFP TECHNOLOGIES INC's sales and general administrative expense to its total operating expenses; 99.85% of US stocks have a lower such ratio.
- Over the past twelve months, UFPT has reported earnings growth of 175.9%, putting it ahead of 92.24% of US stocks in our set.
- If you're looking for stocks that are quantitatively similar to UFP TECHNOLOGIES INC, a group of peers worth examining would be R, AMWD, MATX, TRS, and FDP.
- UFPT's SEC filings can be seen here. And to visit UFP TECHNOLOGIES INC's official web site, go to www.ufpt.com.
UFPT Valuation Summary
- UFPT's price/sales ratio is 3.1; this is 72.22% higher than that of the median Consumer Cyclical stock.
- UFPT's EV/EBIT ratio has moved down 28.2 over the prior 243 months.
Below are key valuation metrics over time for UFPT.
Stock | Date | P/S | P/B | P/E | EV/EBIT |
---|---|---|---|---|---|
UFPT | 2023-05-19 | 3.1 | 4.7 | 24.9 | 19.9 |
UFPT | 2023-05-18 | 3.0 | 4.7 | 24.8 | 19.9 |
UFPT | 2023-05-17 | 3.0 | 4.6 | 24.1 | 19.3 |
UFPT | 2023-05-16 | 3.0 | 4.6 | 24.4 | 19.5 |
UFPT | 2023-05-15 | 3.0 | 4.6 | 24.5 | 19.6 |
UFPT | 2023-05-12 | 3.0 | 4.6 | 24.2 | 19.4 |
UFPT Growth Metrics
- The 5 year price growth rate now stands at 69.32%.
- Its 2 year net cashflow from operations growth rate is now at -76.06%.
- Its 5 year cash and equivalents growth rate is now at -78.27%.

The table below shows UFPT's growth in key financial areas (numbers in millions of US dollars).
Date | Revenue | Operating Cash Flow | Net Income to Common Stock |
---|---|---|---|
2022-09-30 | 318.898 | 0.474 | 36.546 |
2022-09-30 | 318.898 | 0.474 | 36.546 |
2022-06-30 | 272.651 | 4.371 | 20.795 |
2022-03-31 | 228.963 | 7.743 | 16.581 |
2021-12-31 | 206.32 | 14.293 | 15.886 |
2021-09-30 | 195.13 | 21.974 | 16.839 |
UFPT's Quality Factors
The “Quality” component of the POWR Ratings focuses on 31 different factors of a companies fundamentals and operational strength. Here are some key insights as we drill into the specifics of these quality attributes.- UFPT has a Quality Grade of C, ranking ahead of 63.92% of graded US stocks.
- UFPT's asset turnover comes in at 0.904 -- ranking 25th of 186 Medical Equipment stocks.
- CRY, CSII, and KRMD are the stocks whose asset turnover ratios are most correlated with UFPT.
The table below shows UFPT's key quality metrics over time.
Period | Asset Turnover | Gross Margin | ROIC |
---|---|---|---|
2021-06-30 | 0.904 | 0.255 | 0.208 |
2021-03-31 | 0.887 | 0.247 | 0.174 |
2020-12-31 | 0.902 | 0.249 | 0.167 |
2020-09-30 | 0.945 | 0.255 | 0.185 |
2020-06-30 | 0.977 | 0.262 | 0.201 |
2020-03-31 | 1.024 | 0.272 | 0.225 |
UFPT Price Target
For more insight on analysts targets of UFPT, see our UFPT price target page. And for a list of of all stocks sorted by upside potential based on analyst target price, see our Top Price Target page.
Average Price Target | $76.00 | Average Broker Recommendation | 1 (Strong Buy) |
UFP Technologies, Inc. (UFPT) Company Bio
UFP Technologies, Inc. designs and converts foams, plastics, composites, and natural fiber materials and provides solutions to medical, automotive, consumer, electronics, industrial, aerospace, and defense markets in the United States. The company was founded in 1963 and is based in Georgetown, Massachusetts.
Latest UFPT News From Around the Web
Below are the latest news stories about UFP TECHNOLOGIES INC that investors may wish to consider to help them evaluate UFPT as an investment opportunity.
UFP Technologies (NASDAQ:UFPT) stock performs better than its underlying earnings growth over last five yearsWe think all investors should try to buy and hold high quality multi-year winners. While the best companies are hard to... |
UFP Technologies Announces Record Q1 2023 ResultsNEWBURYPORT, Mass., May 02, 2023 (GLOBE NEWSWIRE) -- UFP Technologies, Inc. (Nasdaq: UFPT), a designer and custom manufacturer of comprehensive solutions primarily for the medical market, today reported net income of $9.7 million or $1.27 per diluted common share outstanding for its first quarter ended March 31, 2023, compared to net income of $4.9 million or $0.64 per diluted common share outstanding for the first quarter of 2022. Net Sales for the first quarter were $97.8 million compared to 2 |
Here's Why We Think UFP Technologies (NASDAQ:UFPT) Is Well Worth WatchingFor beginners, it can seem like a good idea (and an exciting prospect) to buy a company that tells a good story to... |
Is UFP Technologies, Inc.'s (NASDAQ:UFPT) Recent Stock Performance Tethered To Its Strong Fundamentals?Most readers would already be aware that UFP Technologies' (NASDAQ:UFPT) stock increased significantly by 13% over the... |
Should You Invest in UFP Technologies (UFPT) for Attractive Returns?Wasatch Global Investors, an asset management company, released its “Wasatch Micro Cap Growth—U.S. Strategy” fourth-quarter 2022 investor letter. A copy of the same can be downloaded here. The strategy declined and underperformed its benchmark, the Russell Microcap Index in the fourth quarter, which gained 4.72%. The disappointing returns in industrials, financials, and consumer discretionary were the […] |
UFPT Price Returns
1-mo | 12.63% |
3-mo | 31.88% |
6-mo | 29.32% |
1-year | 102.36% |
3-year | 243.40% |
5-year | 404.88% |
YTD | 31.69% |
2022 | 67.79% |
2021 | 50.77% |
2020 | -6.07% |
2019 | 65.15% |
2018 | 8.06% |
Continue Researching UFPT
Want to do more research on Ufp Technologies Inc's stock and its price? Try the links below:Ufp Technologies Inc (UFPT) Stock Price | Nasdaq
Ufp Technologies Inc (UFPT) Stock Quote, History and News - Yahoo Finance
Ufp Technologies Inc (UFPT) Stock Price and Basic Information | MarketWatch
Loading social stream, please wait...