
Unisys Corporation New (UIS): Price and Financial Metrics
UIS Price/Volume Stats
| Current price | $4.83 | 52-week high | $8.12 |
| Prev. close | $4.78 | 52-week low | $2.60 |
| Day low | $4.67 | Volume | 287,300 |
| Day high | $4.87 | Avg. volume | 602,634 |
| 50-day MA | $4.45 | Dividend yield | N/A |
| 200-day MA | $5.06 | Market Cap | 334.38M |
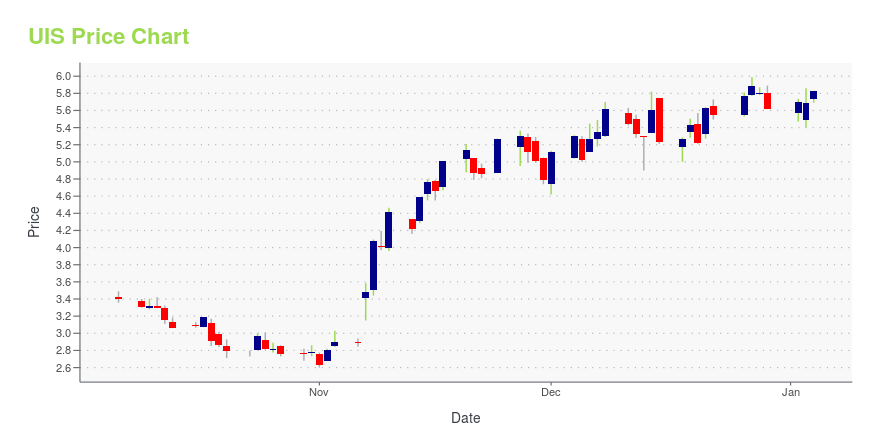
UIS Stock Price Chart Interactive Chart >
Unisys Corporation New (UIS) Company Bio
Unisys provides information technology services worldwide. The company operates through two segments, Services and Technology. The company was founded in 1886 and is based in Blue Bell, Pennsylvania.
Latest UIS News From Around the Web
Below are the latest news stories about UNISYS CORP that investors may wish to consider to help them evaluate UIS as an investment opportunity.
Unisys Earns Dual Honors as Managed Services Provider of the Year and Service Transformation Leader from Service Desk Institute (SDI)Unisys (NYSE: UIS) was honored with two significant accolades — Managed Services Provider (MSP) of the Year and Service Transformation of the Year — from the Service Desk Institute (SDI), a global community of service desk and support professionals. |
Unisys Wins Coveted "The Drum Award" in the B2B Rebrand or Relaunch CategoryUnisys (NYSE: UIS) took home the top prize at The Drum Awards Festival in the B2B: Rebrand or Relaunch category, where the company was recognized for its multidimensional creative strategy that redefined the 150-year-old brand for the first time in more than 35 years. The Drum Awards is one of the largest and most prestigious annual competitions for the global marketing community. |
Unisys Revises Estimate of One-Time, Non-Cash, Pre-Tax Settlement Charge Related to Previously Announced Purchase of Group Annuity ContractsUnisys (NYSE: UIS) announced in a previous statement released on November 27, 2023, annuity purchase agreements to transfer a portion of its U.S. pension obligations. In the release, the company anticipated the action would result in a one-time, non-cash, pre-tax settlement charge of approximately $244 million. The company is revising that estimate to approximately $179 million. The settlement charge will be finalized and communicated as part of the company's year-end 2023 financial results. |
Unisys Named a Leader in 2023 ISG Provider Lens™️ Future of Work (Workplace) -- Services and Solutions Report (Global)Unisys (NYSE: UIS) has been recognized as a leader in the 2023 ISG Provider Lens™️ Future of Work (Workplace) – Services and Solutions Report. The report, produced by prominent global technology research and advisory firm Information Services Group (ISG), evaluates service providers' abilities to help organizations and governments evolve to meet today's workplace challenges. ISG awarded Unisys 22 leader designations across six regions – including the U.S., U.S. Public Sector, Australia, Brazil, |
An Intrinsic Calculation For Unisys Corporation (NYSE:UIS) Suggests It's 44% UndervaluedKey Insights Unisys' estimated fair value is US$10.07 based on 2 Stage Free Cash Flow to Equity Unisys is estimated to... |
UIS Price Returns
| 1-mo | 17.80% |
| 3-mo | -11.54% |
| 6-mo | -33.10% |
| 1-year | -10.22% |
| 3-year | -77.74% |
| 5-year | -53.38% |
| YTD | -14.06% |
| 2023 | 9.98% |
| 2022 | -75.16% |
| 2021 | 4.52% |
| 2020 | 65.94% |
| 2019 | 1.98% |
Continue Researching UIS
Want to see what other sources are saying about Unisys Corp's financials and stock price? Try the links below:Unisys Corp (UIS) Stock Price | Nasdaq
Unisys Corp (UIS) Stock Quote, History and News - Yahoo Finance
Unisys Corp (UIS) Stock Price and Basic Information | MarketWatch
Loading social stream, please wait...