
Ulta Beauty Inc. (ULTA): Price and Financial Metrics
ULTA Price/Volume Stats
| Current price | $369.46 | 52-week high | $574.76 |
| Prev. close | $363.30 | 52-week low | $362.49 |
| Day low | $362.49 | Volume | 1,023,100 |
| Day high | $372.37 | Avg. volume | 814,219 |
| 50-day MA | $388.66 | Dividend yield | N/A |
| 200-day MA | $443.80 | Market Cap | 17.63B |
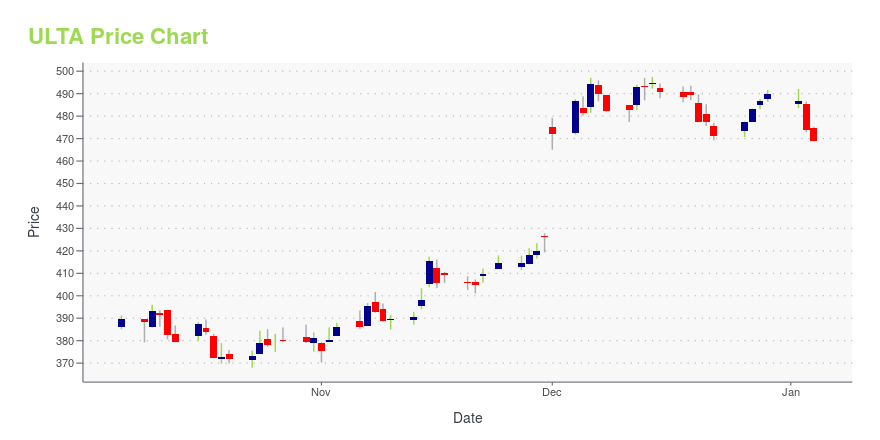
ULTA Stock Price Chart Interactive Chart >
Ulta Beauty Inc. (ULTA) Company Bio
Ulta Beauty, Inc., formerly known as Ulta Salon, Cosmetics & Fragrance Inc. and before 2000 as Ulta3, is an American chain of beauty stores headquartered in Bolingbrook, Illinois. Ulta Beauty carries cosmetics, fragrances, nail products, bath and body products, beauty tools and haircare products. Each store also has a beauty salon. (Source:Wikipedia)
Latest ULTA News From Around the Web
Below are the latest news stories about ULTA BEAUTY INC that investors may wish to consider to help them evaluate ULTA as an investment opportunity.
Not so 'Super' Saturday: Retailers dangle fewer discounts for inflation-weary shoppersLast-minute shoppers looking for late deals ahead of Christmas may find smaller discounts and fewer items marked down at major retailers including Macy’s, Target and Ulta Beauty, according to an analyst and two datasets measuring retailers' recent prices. After ramping up promotions for Black Friday, some of the country’s top gifting destinations cut back both the number and size of their price markdowns on key products from Nov. 1 to Dec. 1, according to data from Centric Market Intelligence, formerly StyleSage, which analyzes retailers, brands, online trends and products across the globe. Data analytics firm Vertical Knowledge, which examines pricing and discounts across retailers’ websites, found retailers including Abercrombie & Fitch and Macy's-owned Bloomingdale’s also shrank or... |
Best Blue-Chip Stocks 2024: 7 to Add to Your Must-Buy ListWhile mega-cap technology stocks led the way over the past year, the market rally is now maturing and broadening out to include other securities. |
Ulta Beauty to expand and refresh loyalty programThe loyalty program, which has over 42 million active members, will launch in January with a new name and an enhanced birthday gift experience. |
Why Ulta Beauty (ULTA) is a Top Stock for the Long-TermWondering how to pick strong, market-beating stocks for your investment portfolio? Look no further than the Zacks Focus List. |
Insider Sell: Director Lorna Nagler Sells Shares of Ulta Beauty Inc (ULTA)Director Lorna Nagler of Ulta Beauty Inc (NASDAQ:ULTA) has recently parted with 500 shares of the company's stock, a transaction that took place on December 13, 2023. |
ULTA Price Returns
| 1-mo | -4.75% |
| 3-mo | -9.09% |
| 6-mo | -25.15% |
| 1-year | -17.61% |
| 3-year | 9.46% |
| 5-year | 4.40% |
| YTD | -24.60% |
| 2023 | 4.46% |
| 2022 | 13.76% |
| 2021 | 43.59% |
| 2020 | 13.44% |
| 2019 | 3.39% |
Continue Researching ULTA
Want to do more research on Ulta Beauty Inc's stock and its price? Try the links below:Ulta Beauty Inc (ULTA) Stock Price | Nasdaq
Ulta Beauty Inc (ULTA) Stock Quote, History and News - Yahoo Finance
Ulta Beauty Inc (ULTA) Stock Price and Basic Information | MarketWatch
Loading social stream, please wait...