Urban Outfitters, Inc. (URBN): Price and Financial Metrics
GET POWR RATINGS... FREE!
URBN POWR Grades
- Value is the dimension where URBN ranks best; there it ranks ahead of 80.17% of US stocks.
- URBN's strongest trending metric is Growth; it's been moving up over the last 177 days.
- URBN's current lowest rank is in the Stability metric (where it is better than 20.96% of US stocks).
URBN Stock Summary
- URBAN OUTFITTERS INC's capital turnover -- a measure of revenue relative to shareholder's equity -- is better than 81.05% of US listed stocks.
- Of note is the ratio of URBAN OUTFITTERS INC's sales and general administrative expense to its total operating expenses; 85.76% of US stocks have a lower such ratio.
- URBN's price/sales ratio is 0.56; that's higher than the P/S ratio of just 16.08% of US stocks.
- Stocks with similar financial metrics, market capitalization, and price volatility to URBAN OUTFITTERS INC are ZUMZ, KRT, STRT, SCVL, and CVCO.
- URBN's SEC filings can be seen here. And to visit URBAN OUTFITTERS INC's official web site, go to www.urbn.com.
URBN Valuation Summary
- URBN's EV/EBIT ratio is 15.5; this is 9.93% higher than that of the median Consumer Cyclical stock.
- Over the past 243 months, URBN's price/sales ratio has gone down 0.3.
Below are key valuation metrics over time for URBN.
Stock | Date | P/S | P/B | P/E | EV/EBIT |
---|---|---|---|---|---|
URBN | 2023-02-02 | 0.6 | 1.5 | 15.8 | 15.5 |
URBN | 2023-02-01 | 0.5 | 1.5 | 15.3 | 15.2 |
URBN | 2023-01-31 | 0.5 | 1.5 | 14.9 | 14.9 |
URBN | 2023-01-30 | 0.5 | 1.4 | 14.5 | 14.5 |
URBN | 2023-01-27 | 0.5 | 1.4 | 14.6 | 14.6 |
URBN | 2023-01-26 | 0.5 | 1.4 | 14.6 | 14.6 |
URBN Growth Metrics
- Its year over year price growth rate is now at -42.56%.
- Its 3 year net cashflow from operations growth rate is now at -42%.
- Its 5 year net cashflow from operations growth rate is now at -47.39%.

The table below shows URBN's growth in key financial areas (numbers in millions of US dollars).
Date | Revenue | Operating Cash Flow | Net Income to Common Stock |
---|---|---|---|
2022-09-30 | 4,742.87 | 130.87 | 169.189 |
2022-06-30 | 4,698.945 | 132.463 | 220.813 |
2022-03-31 | 4,673.282 | 242.656 | 288.602 |
2021-12-31 | 4,548.763 | 359.319 | 310.616 |
2021-09-30 | 4,304.957 | 293.424 | 298.238 |
2021-06-30 | 4,143.14 | 365.791 | 286.087 |
URBN's Quality Factors
The “Quality” component of the POWR Ratings focuses on 31 different factors of a companies fundamentals and operational strength. Here are some key insights as we drill into the specifics of these quality attributes.- URBN has a Quality Grade of B, ranking ahead of 84.14% of graded US stocks.
- URBN's asset turnover comes in at 1.151 -- ranking 122nd of 165 Retail stocks.
- CHS, AEO, and BURL are the stocks whose asset turnover ratios are most correlated with URBN.
The table below shows URBN's key quality metrics over time.
Period | Asset Turnover | Gross Margin | ROIC |
---|---|---|---|
2021-07-31 | 1.151 | 0.325 | 0.106 |
2021-04-30 | 1.076 | 0.304 | 0.080 |
2021-01-31 | 0.996 | 0.250 | 0.002 |
2020-10-31 | 1.036 | 0.257 | 0.002 |
2020-07-31 | 1.058 | 0.255 | -0.004 |
2020-04-30 | 1.130 | 0.265 | 0.000 |
URBN Price Target
For more insight on analysts targets of URBN, see our URBN price target page. And for a list of of all stocks sorted by upside potential based on analyst target price, see our Top Price Target page.
Average Price Target | $43.06 | Average Broker Recommendation | 1.75 (Moderate Buy) |
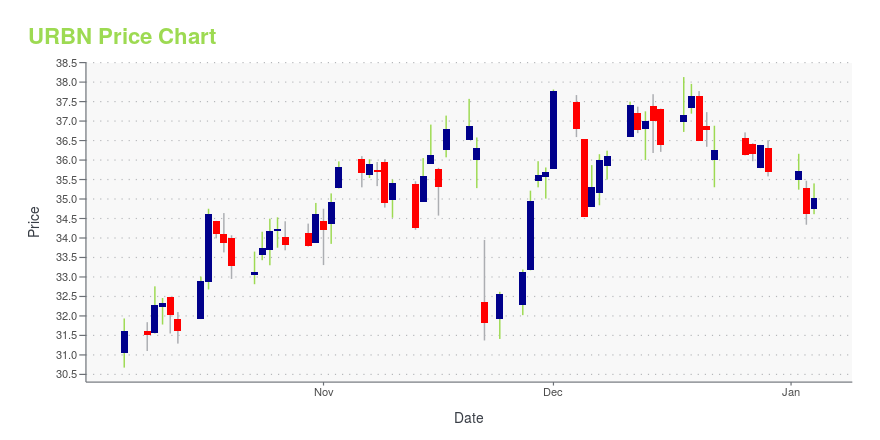
URBN Stock Price Chart Interactive Chart >
URBN Price/Volume Stats
Current price | $27.88 | 52-week high | $30.52 |
Prev. close | $28.57 | 52-week low | $17.81 |
Day low | $27.63 | Volume | 1,506,900 |
Day high | $28.48 | Avg. volume | 1,644,624 |
50-day MA | $26.97 | Dividend yield | N/A |
200-day MA | $23.18 | Market Cap | 2.57B |
Urban Outfitters, Inc. (URBN) Company Bio
Urban Outfitters offer womens and mens fashion apparel, intimates, footwear, beauty and accessories, activewear and gear, and electronics, as well as an eclectic mix of apartment wares and gifts to young adults aged 18 to 28. The company was founded in 1970 and is based in Philadelphia, Pennsylvania.
Latest URBN News From Around the Web
Below are the latest news stories about URBAN OUTFITTERS INC that investors may wish to consider to help them evaluate URBN as an investment opportunity.
Is MercadoLibre (MELI) Outperforming Other Retail-Wholesale Stocks This Year?Here is how MercadoLibre (MELI) and Urban Outfitters (URBN) have performed compared to their sector so far this year. |
Here's What's Concerning About Urban Outfitters' (NASDAQ:URBN) Returns On CapitalIf we want to find a potential multi-bagger, often there are underlying trends that can provide clues. One common... |
Urban Outfitters Stock Could Reclaim Fresh Annual HighsThere are several factors that indicate a rally may come for URBN next month |
Is American Eagle Outfitters (AEO) Stock Undervalued Right Now?Here at Zacks, our focus is on the proven Zacks Rank system, which emphasizes earnings estimates and estimate revisions to find great stocks. Nevertheless, we are always paying attention to the latest value, growth, and momentum trends to underscore strong picks. |
Urban Outfitters (URBN) Just Overtook the 50-Day Moving AverageGood things could be on the horizon when a stock surpasses the 50-Day simple moving average. How should investors react? |
URBN Price Returns
1-mo | 9.51% |
3-mo | 12.65% |
6-mo | 25.08% |
1-year | -6.38% |
3-year | 7.52% |
5-year | -18.55% |
YTD | 16.90% |
2022 | -18.77% |
2021 | 14.69% |
2020 | -7.81% |
2019 | -16.36% |
2018 | -5.31% |
Continue Researching URBN
Want to do more research on Urban Outfitters Inc's stock and its price? Try the links below:Urban Outfitters Inc (URBN) Stock Price | Nasdaq
Urban Outfitters Inc (URBN) Stock Quote, History and News - Yahoo Finance
Urban Outfitters Inc (URBN) Stock Price and Basic Information | MarketWatch
Loading social stream, please wait...