Ur-Energy Inc. (URG): Price and Financial Metrics
GET POWR RATINGS... FREE!
URG POWR Grades
- URG scores best on the Growth dimension, with a Growth rank ahead of 46.89% of US stocks.
- URG's strongest trending metric is Stability; it's been moving up over the last 177 days.
- URG's current lowest rank is in the Value metric (where it is better than 0.02% of US stocks).
URG Stock Summary
- UR-ENERGY INC's capital turnover -- a measure of revenue relative to shareholder's equity -- is better than only 7.39% of US listed stocks.
- Of note is the ratio of UR-ENERGY INC's sales and general administrative expense to its total operating expenses; 87.12% of US stocks have a lower such ratio.
- With a price/sales ratio of 11,940.57, UR-ENERGY INC has a higher such ratio than 99.96% of stocks in our set.
- Stocks that are quantitatively similar to URG, based on their financial statements, market capitalization, and price volatility, are SKYH, AQMS, SOBR, ENZN, and MOXC.
- URG's SEC filings can be seen here. And to visit UR-ENERGY INC's official web site, go to www.ur-energy.com.
URG Valuation Summary
- URG's price/earnings ratio is -13.2; this is 209.09% lower than that of the median Basic Materials stock.
- URG's price/earnings ratio has moved up 14.7 over the prior 178 months.
Below are key valuation metrics over time for URG.
Stock | Date | P/S | P/B | P/E | EV/EBIT |
---|---|---|---|---|---|
URG | 2023-03-24 | 11942.1 | 3.6 | -13.2 | -12.3 |
URG | 2023-03-23 | 12542.1 | 3.8 | -13.9 | -13.0 |
URG | 2023-03-22 | 12736.8 | 3.9 | -14.1 | -13.2 |
URG | 2023-03-21 | 12889.5 | 3.9 | -14.3 | -13.4 |
URG | 2023-03-20 | 12621.1 | 3.8 | -14.0 | -13.1 |
URG | 2023-03-17 | 13026.3 | 4.0 | -14.4 | -13.5 |
URG Growth Metrics
- Its year over year price growth rate is now at -4.29%.
- Its year over year net income to common stockholders growth rate is now at -21.48%.
- Its 5 year cash and equivalents growth rate is now at -18.14%.

The table below shows URG's growth in key financial areas (numbers in millions of US dollars).
Date | Revenue | Operating Cash Flow | Net Income to Common Stock |
---|---|---|---|
2022-09-30 | 0.019 | -14.901 | -11.822 |
2022-06-30 | 0.028 | -12.303 | -15.968 |
2022-03-31 | 0.016 | -11.844 | -22.494 |
2021-12-31 | 0.016 | -11.698 | -22.938 |
2021-09-30 | 0.028 | -11.732 | -28.58 |
2021-06-30 | 0.019 | -11.179 | -23.168 |
URG's Quality Factors
The “Quality” component of the POWR Ratings focuses on 31 different factors of a companies fundamentals and operational strength. Here are some key insights as we drill into the specifics of these quality attributes.- URG has a Quality Grade of D, ranking ahead of 22.19% of graded US stocks.
- URG's asset turnover comes in at 0 -- ranking 31st of 47 Precious Metals stocks.
- FNV, HYMC, and GOLD are the stocks whose asset turnover ratios are most correlated with URG.
The table below shows URG's key quality metrics over time.
Period | Asset Turnover | Gross Margin | ROIC |
---|---|---|---|
2021-09-30 | 0.000 | -238.893 | -0.333 |
2021-06-30 | 0.000 | -359.737 | -0.260 |
2021-03-31 | 0.080 | -0.661 | -0.206 |
2020-12-31 | 0.097 | -0.559 | -0.164 |
2020-09-30 | 0.219 | 0.065 | -0.079 |
2020-06-30 | 0.276 | 0.028 | -0.088 |
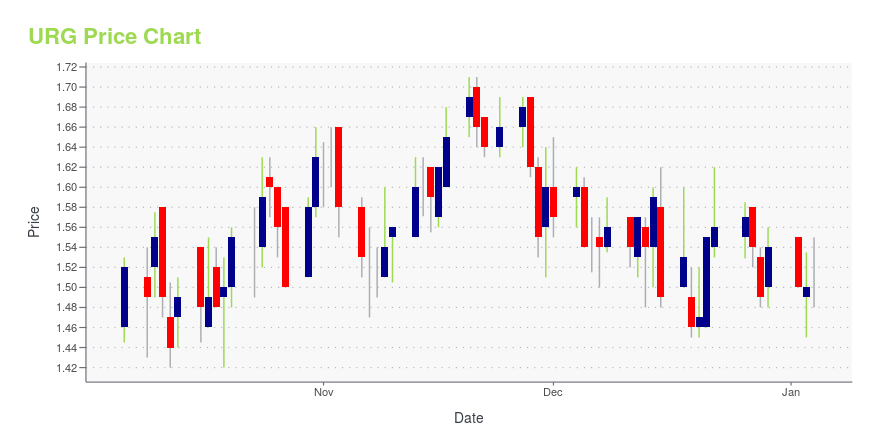
URG Stock Price Chart Interactive Chart >
URG Price/Volume Stats
Current price | $0.99 | 52-week high | $1.90 |
Prev. close | $0.95 | 52-week low | $0.85 |
Day low | $0.92 | Volume | 1,360,194 |
Day high | $0.99 | Avg. volume | 1,414,932 |
50-day MA | $1.11 | Dividend yield | N/A |
200-day MA | $1.18 | Market Cap | 260.89M |
Ur-Energy Inc. (URG) Company Bio
Ur-Energy, Inc. explores for uranium. The Company operates in Nunavut in Canada and Wyoming in the United States.
Latest URG News From Around the Web
Below are the latest news stories about UR-ENERGY INC that investors may wish to consider to help them evaluate URG as an investment opportunity.
Ur-Energy Releases 2022 Year End ResultsUr-Energy Inc. (NYSE American:URG)(TSX:URE) ("Ur-Energy" or the "Company") has filed the Company's Annual Report on Form 10-K, Consolidated Financial Statements, and Management's Discussion & Analysis, all for the year ended December 31, 2022, with the U.S. Securities and Exchange Commission on EDGAR at www.sec.gov/edgar.shtml and with Canadian securities authorities on SEDAR at www.sedar.com. |
Ur-Energy Inc.'s (TSE:URE) top owners are individual investors with 48% stake, while 30% is held by institutionsIf you want to know who really controls Ur-Energy Inc. ( TSE:URE ), then you'll have to look at the makeup of its share... |
GNS Stock Alert: What to Know as Genius Group Plans Share BuybackGenius Group (GNS) stock is on the move Thursday after investors approved new share buyback and stock consolidation plans. |
Today’s Biggest Pre-Market Stock Movers: 10 Top Gainers and Losers on ThursdayIt's time to start the day with an overview of the biggest pre-market stock movers worth keeping an eye on Thursday morning! |
Why Is NexImmune (NEXI) Stock Up 65% Today?NexImmune (NEXI) stock is rocketing higher on Thursday following the release of positive preclinical trial data for a cancer treatment. |
URG Price Returns
1-mo | -7.48% |
3-mo | -13.91% |
6-mo | -9.17% |
1-year | -37.74% |
3-year | 164.78% |
5-year | 65.00% |
YTD | -13.91% |
2022 | -5.74% |
2021 | 52.27% |
2020 | 36.14% |
2019 | -9.46% |
2018 | -4.41% |
Continue Researching URG
Want to see what other sources are saying about Ur-Energy Inc's financials and stock price? Try the links below:Ur-Energy Inc (URG) Stock Price | Nasdaq
Ur-Energy Inc (URG) Stock Quote, History and News - Yahoo Finance
Ur-Energy Inc (URG) Stock Price and Basic Information | MarketWatch
Loading social stream, please wait...