United Rentals Inc. (URI): Price and Financial Metrics
URI Price/Volume Stats
Current price | $721.11 | 52-week high | $732.37 |
Prev. close | $720.15 | 52-week low | $325.15 |
Day low | $717.17 | Volume | 440,300 |
Day high | $724.95 | Avg. volume | 594,662 |
50-day MA | $661.34 | Dividend yield | 0.93% |
200-day MA | $515.50 | Market Cap | 48.45B |
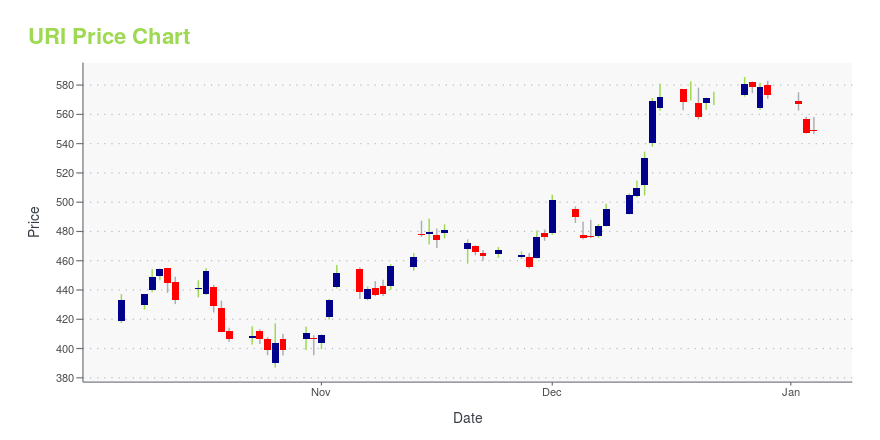
URI Stock Price Chart Interactive Chart >
URI POWR Grades
- URI scores best on the Momentum dimension, with a Momentum rank ahead of 97.55% of US stocks.
- The strongest trend for URI is in Stability, which has been heading down over the past 26 weeks.
- URI's current lowest rank is in the Value metric (where it is better than 15.41% of US stocks).
URI Stock Summary
- URI has a market capitalization of $37,087,298,182 -- more than approximately 93.02% of US stocks.
- The ratio of debt to operating expenses for UNITED RENTALS INC is higher than it is for about 86.47% of US stocks.
- Revenue growth over the past 12 months for UNITED RENTALS INC comes in at 24.98%, a number that bests 81.45% of the US stocks we're tracking.
- If you're looking for stocks that are quantitatively similar to UNITED RENTALS INC, a group of peers worth examining would be APTV, FLT, IR, SU, and PWR.
- URI's SEC filings can be seen here. And to visit UNITED RENTALS INC's official web site, go to www.unitedrentals.com.
URI Valuation Summary
- In comparison to the median Industrials stock, URI's price/earnings ratio is 27.88% lower, now standing at 16.3.
- URI's price/earnings ratio has moved up 25.7 over the prior 243 months.
Below are key valuation metrics over time for URI.
Stock | Date | P/S | P/B | P/E | EV/EBIT |
---|---|---|---|---|---|
URI | 2023-12-29 | 2.8 | 5.0 | 16.3 | 13.5 |
URI | 2023-12-28 | 2.8 | 5.1 | 16.5 | 13.6 |
URI | 2023-12-27 | 2.8 | 5.1 | 16.5 | 13.6 |
URI | 2023-12-26 | 2.8 | 5.1 | 16.5 | 13.6 |
URI | 2023-12-22 | 2.8 | 5.0 | 16.2 | 13.5 |
URI | 2023-12-21 | 2.8 | 5.0 | 16.2 | 13.5 |
URI Growth Metrics
- Its year over year price growth rate is now at -4.69%.
- Its 5 year net income to common stockholders growth rate is now at 101.03%.
- Its 4 year price growth rate is now at 7.14%.
The table below shows URI's growth in key financial areas (numbers in millions of US dollars).
Date | Revenue | Operating Cash Flow | Net Income to Common Stock |
---|---|---|---|
2022-12-31 | 11,642 | 4,433 | 2,105 |
2022-09-30 | 11,122 | 3,850 | 1,947 |
2022-06-30 | 10,667 | 3,795 | 1,750 |
2022-03-31 | 10,183 | 3,817 | 1,550 |
2021-12-31 | 9,716 | 3,689 | 1,386 |
2021-09-30 | 9,219 | 3,391 | 1,202 |
URI's Quality Factors
The “Quality” component of the POWR Ratings focuses on 31 different factors of a companies fundamentals and operational strength. Here are some key insights as we drill into the specifics of these quality attributes.- URI has a Quality Grade of B, ranking ahead of 86.72% of graded US stocks.
- URI's asset turnover comes in at 0.489 -- ranking 324th of 561 Business Services stocks.
- TTEC, NATI, and TBI are the stocks whose asset turnover ratios are most correlated with URI.
The table below shows URI's key quality metrics over time.
Period | Asset Turnover | Gross Margin | ROIC |
---|---|---|---|
2021-09-30 | 0.489 | 0.386 | 0.099 |
2021-06-30 | 0.483 | 0.380 | 0.094 |
2021-03-31 | 0.475 | 0.375 | 0.090 |
2020-12-31 | 0.470 | 0.373 | 0.086 |
2020-09-30 | 0.473 | 0.377 | 0.088 |
2020-06-30 | 0.480 | 0.380 | 0.090 |
URI Price Target
For more insight on analysts targets of URI, see our URI price target page. And for a list of of all stocks sorted by upside potential based on analyst target price, see our Top Price Target page.
Average Price Target | $361.13 | Average Broker Recommendation | 1.63 (Moderate Buy) |
United Rentals Inc. (URI) Company Bio
United Rentals, Inc. (NYSE: URI) is the world's largest equipment rental company, with about 13 percent of the North American market share as of 2019. It owns the largest rental fleet in the world with about 660,000 rental units totaling about $14.2 billion in original equipment cost (OEC). The company has a workforce of approximately 18,800 employees, and operates 1,186 locations across 49 U.S. states, 10 Canadian provinces, Puerto Rico and four European countries. In 2017, United Rentals' revenue totaled more than $6.64 billion, with over $1.35 billion in profit. It is ranked #424 on the Fortune 500, and #1183 on the Forbes Global 2000 list of the world's largest public companies. (Source:Wikipedia)
Latest URI News From Around the Web
Below are the latest news stories about UNITED RENTALS INC that investors may wish to consider to help them evaluate URI as an investment opportunity.
We're Picking Vulcan for 2024 as Construction Activity Is Expected to Boom2023 was a good year for nonresidential construction, and the Action Alerts PLUS portfolio profited handsomely with the shares of United Rentals , to a lesser extent Vulcan Materials , and indirectly with the shares of Deere . |
If You Invested $1000 in United Rentals a Decade Ago, This is How Much It'd Be Worth NowInvesting in certain stocks can pay off in the long run, especially if you hold on for a decade or more. |
Is It Time To Consider Buying United Rentals, Inc. (NYSE:URI)?United Rentals, Inc. ( NYSE:URI ) saw a significant share price rise of 43% in the past couple of months on the NYSE... |
United Rentals Selected as One of America’s Best Managed CompaniesSTAMFORD, Conn., December 22, 2023--United Rentals, Inc. (NYSE: URI), the world’s largest equipment rental company, today announced it was selected as one of the U.S. Best Managed Companies in the Drucker Institute’s annual Management Top 250 ranking. The prestigious award, presented by The Wall Street Journal, recognizes well-run companies that deliver value to customers, employees and investors. |
My 2024 Stock Pick Has All the Right 'Materials' for SuccessLet's see how United Rentals and Vulcan Materials stack up for the new year and see which is my best bet. |
URI Price Returns
1-mo | 5.09% |
3-mo | 26.07% |
6-mo | 63.15% |
1-year | 89.21% |
3-year | 120.01% |
5-year | 541.67% |
YTD | 26.07% |
2023 | 63.62% |
2022 | 6.96% |
2021 | 43.28% |
2020 | 39.06% |
2019 | 62.65% |
URI Dividends
Ex-Dividend Date | Type | Payout Amount | Change | ||||||
---|---|---|---|---|---|---|---|---|---|
Loading, please wait... |
Continue Researching URI
Here are a few links from around the web to help you further your research on United Rentals Inc's stock as an investment opportunity:United Rentals Inc (URI) Stock Price | Nasdaq
United Rentals Inc (URI) Stock Quote, History and News - Yahoo Finance
United Rentals Inc (URI) Stock Price and Basic Information | MarketWatch
Loading social stream, please wait...