
Universal Stainless & Alloy Products, Inc. (USAP): Price and Financial Metrics
USAP Price/Volume Stats
| Current price | $33.06 | 52-week high | $34.75 |
| Prev. close | $32.63 | 52-week low | $11.13 |
| Day low | $32.91 | Volume | 157,100 |
| Day high | $33.70 | Avg. volume | 127,004 |
| 50-day MA | $30.64 | Dividend yield | N/A |
| 200-day MA | $22.62 | Market Cap | 303.82M |
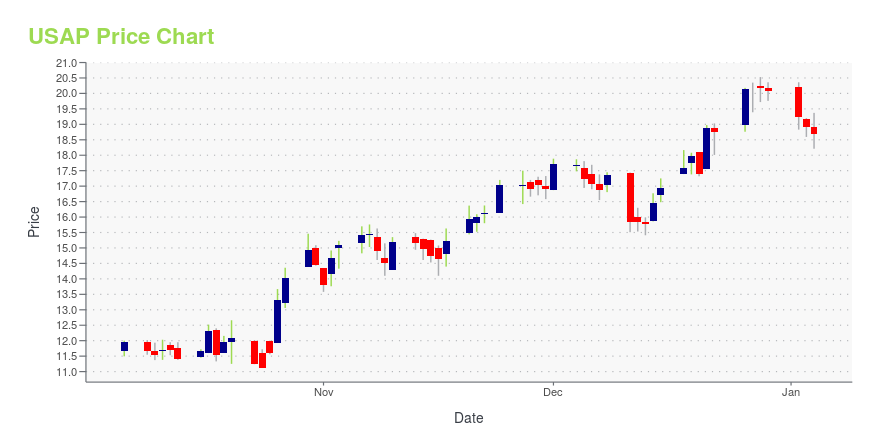
USAP Stock Price Chart Interactive Chart >
Universal Stainless & Alloy Products, Inc. (USAP) Company Bio
Universal Stainless & Alloy Products, Inc. manufacture and market semi-finished and finished specialty steel products in the United States and internationally. The companys products include stainless steel, nickel alloys, tool steel, and various other alloyed steels. The company was founded in 1994 and is based in Bridgeville, Pennsylvania.
Latest USAP News From Around the Web
Below are the latest news stories about UNIVERSAL STAINLESS & ALLOY PRODUCTS INC that investors may wish to consider to help them evaluate USAP as an investment opportunity.
Universal Stainless (USAP) Hits 52-Week High: What's Driving it?Universal Stainless' (USAP) rally reflects a robust third-quarter performance on the back of record aerospace sales. |
Universal Stainless (USAP) Moves 7.4% Higher: Will This Strength Last?Universal Stainless (USAP) witnessed a jump in share price last session on above-average trading volume. The latest trend in earnings estimate revisions for the stock doesn't suggest further strength down the road. |
Universal Stainless (USAP) Up 39% in 6 Months: Here's WhyUniversal Stainless' (USAP) rally reflects a robust third-quarter performance on the back of record aerospace sales. |
4 Steel Stocks That Have Gained More Than 30% This YearAn uptick in automotive demand, rising steel prices and the sizable infrastructure investment augur well for the steel industry heading into 2024. USAP, SSAAY, ZEUS and TX are likely to continue their momentum. |
Universal Stainless Engages EisnerAmper as New Audit FirmBRIDGEVILLE, Pa., Dec. 18, 2023 (GLOBE NEWSWIRE) -- Universal Stainless & Alloy Products, Inc. (Nasdaq: USAP) announced today that it has engaged and appointed EisnerAmper, LLP (“EisnerAmper”) as the Company’s independent registered public accounting firm for the fiscal year ending December 31, 2023. EisnerAmper replaces Baker Tilly, which informed the Company of its decision to resign on November 7, 2023, as previously reported. At that time Baker Tilly said that there were no disagreements on |
USAP Price Returns
| 1-mo | 16.24% |
| 3-mo | 24.52% |
| 6-mo | 67.05% |
| 1-year | 113.29% |
| 3-year | 198.92% |
| 5-year | 97.49% |
| YTD | 64.64% |
| 2023 | 180.06% |
| 2022 | -9.70% |
| 2021 | 6.15% |
| 2020 | -49.80% |
| 2019 | -8.08% |
Continue Researching USAP
Want to see what other sources are saying about Universal Stainless & Alloy Products Inc's financials and stock price? Try the links below:Universal Stainless & Alloy Products Inc (USAP) Stock Price | Nasdaq
Universal Stainless & Alloy Products Inc (USAP) Stock Quote, History and News - Yahoo Finance
Universal Stainless & Alloy Products Inc (USAP) Stock Price and Basic Information | MarketWatch
Loading social stream, please wait...