
Americas Gold & Silver Corp. (USAS): Price and Financial Metrics
USAS Price/Volume Stats
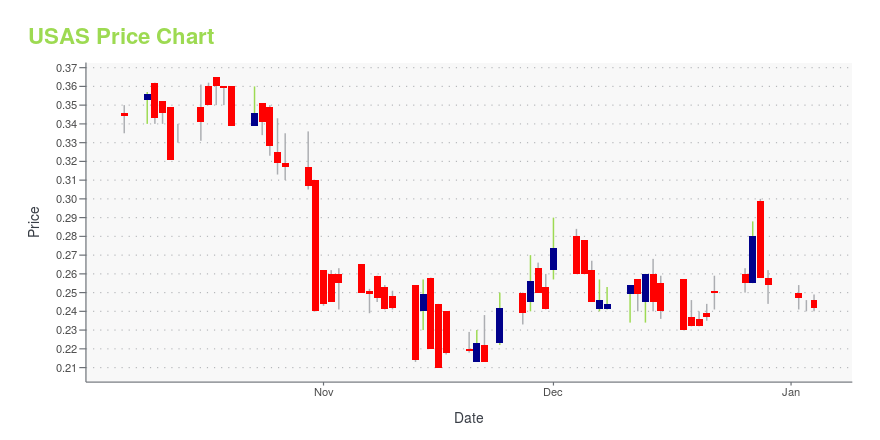
| Current price | $0.24 | 52-week high | $0.44 |
| Prev. close | $0.24 | 52-week low | $0.20 |
| Day low | $0.24 | Volume | 422,100 |
| Day high | $0.25 | Avg. volume | 1,071,817 |
| 50-day MA | $0.28 | Dividend yield | N/A |
| 200-day MA | $0.26 | Market Cap | 62.88M |
USAS Stock Price Chart Interactive Chart >
Americas Gold & Silver Corp. (USAS) Company Bio
Americas Silver Corporation engages in the acquisition, evaluation, exploration, development, and operation of precious metals mineral properties in North America. The company was formerly known as Scorpio Mining Corporation and changed its name to Americas Silver Corporation in May 2015. Americas Silver Corporation was founded in 1998 and is based in Toronto, Canada.
Latest USAS News From Around the Web
Below are the latest news stories about AMERICAS GOLD & SILVER CORP that investors may wish to consider to help them evaluate USAS as an investment opportunity.
Americas Gold and Silver Reports Q3-2023 ResultsTORONTO, November 15, 2023--Americas Gold and Silver Corporation (TSX: USA) (NYSE American: USAS) ("Americas" or the "Company"), a growing North American precious metals producer, reports consolidated financial and operational results for the quarter ended September 30, 2023. |
Americas Gold and Silver Corporation Provides Q3-2023 Production Results With an Increase of 17% in Attributable Silver ProductionTORONTO, October 30, 2023--Americas Gold and Silver Corporation (TSX: USA) (NYSE American: USAS) ("Americas" or the "Company"), a growing North American precious metals producer, is pleased to provide its Q3-2023 production results. |
Americas Gold and Silver Reports Q2-2023 ResultsTORONTO, August 14, 2023--Americas Gold and Silver Corporation (TSX: USA) (NYSE American: USAS) ("Americas" or the "Company"), a growing North American precious metals producer, reports consolidated financial and operational results for the quarter ended June 30, 2023. |
Americas Gold and Silver Corporation Provides Q2-2023 Production Results; Attributable Silver Production Increased by 92% Year-over-yearTORONTO, July 17, 2023--Americas Gold and Silver Corporation (TSX: USA) (NYSE American: USAS) ("Americas" or the "Company"), a growing North American precious metals producer, is pleased to provide its Q2-2023 production results. |
Americas Gold and Silver Corporation Announces Election of Directors and Annual Meeting Voting Results; Issuance of C$8.0 Million Secured Convertible DebentureTORONTO, June 21, 2023--Americas Gold and Silver Corporation ("the "Company") (TSX:USA; NYSE American: USAS) is pleased to announce that the nominees listed in the management proxy circular dated May 11, 2023 for the Company’s annual and special meeting of Shareholders held June 20, 2023 (the "Meeting") were elected as directors of the Company at the Meeting. Detailed results of the vote for the election of directors held at the Meeting yesterday in Toronto as well as the results for other matte |
USAS Price Returns
| 1-mo | 5.40% |
| 3-mo | -13.58% |
| 6-mo | 3.45% |
| 1-year | -39.85% |
| 3-year | -81.68% |
| 5-year | -91.14% |
| YTD | -5.51% |
| 2023 | -55.31% |
| 2022 | -29.52% |
| 2021 | -75.04% |
| 2020 | 1.89% |
| 2019 | 92.12% |
Continue Researching USAS
Want to do more research on Americas Gold & Silver Corp's stock and its price? Try the links below:Americas Gold & Silver Corp (USAS) Stock Price | Nasdaq
Americas Gold & Silver Corp (USAS) Stock Quote, History and News - Yahoo Finance
Americas Gold & Silver Corp (USAS) Stock Price and Basic Information | MarketWatch
Loading social stream, please wait...