USANA Health Sciences, Inc. (USNA): Price and Financial Metrics

USANA Health Sciences, Inc. (USNA): $63.68

-0.36 (-0.56%)

POWR Rating

Component Grades

Momentum

D

Stability

B

Sentiment

Quality

A

Add USNA to Watchlist
Sign Up

Industry: Medical - Consumer Goods

Industry

A

Ranked

#2 of 7

in industry

USNA Price/Volume Stats

Current price $63.68 52-week high $76.58
Prev. close $64.04 52-week low $48.61
Day low $63.26 Volume 53,055
Day high $64.07 Avg. volume 69,517
50-day MA $64.24 Dividend yield N/A
200-day MA $59.31 Market Cap 1.23B

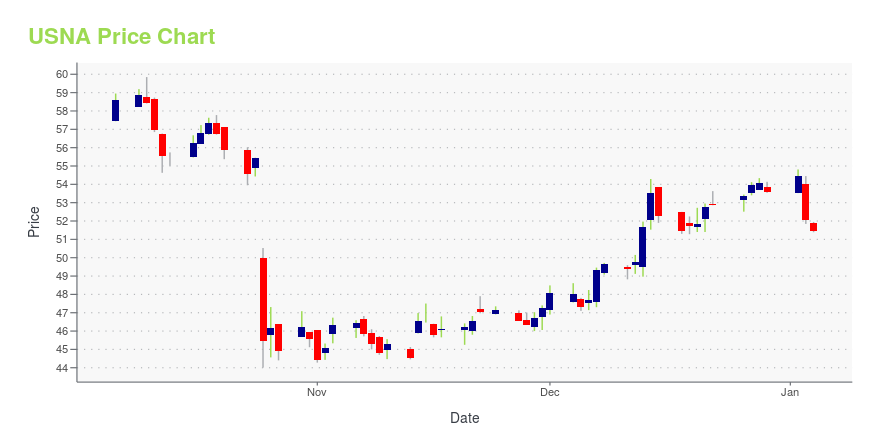
USNA Stock Price Chart Interactive Chart >

USNA POWR Grades

  • USNA scores best on the Quality dimension, with a Quality rank ahead of 99.83% of US stocks.
  • The strongest trend for USNA is in Sentiment, which has been heading up over the past 179 days.
  • USNA ranks lowest in Momentum; there it ranks in the 5th percentile.

USNA Stock Summary

  • For USNA, its debt to operating expenses ratio is greater than that reported by merely 0.41% of US equities we're observing.
  • With a year-over-year growth in debt of -100%, USANA HEALTH SCIENCES INC's debt growth rate surpasses just 0.02% of about US stocks.
  • As for revenue growth, note that USNA's revenue has grown -15.4% over the past 12 months; that beats the revenue growth of only 13.56% of US companies in our set.
  • Stocks that are quantitatively similar to USNA, based on their financial statements, market capitalization, and price volatility, are EPM, YCBD, HYFM, GNLN, and MGLD.
  • USNA's SEC filings can be seen here. And to visit USANA HEALTH SCIENCES INC's official web site, go to www.usana.com.

USNA Valuation Summary

  • In comparison to the median Consumer Defensive stock, USNA's price/sales ratio is 9.09% higher, now standing at 1.2.
  • Over the past 243 months, USNA's price/sales ratio has gone down 1.2.

Below are key valuation metrics over time for USNA.

Stock Date P/S P/B P/E EV/EBIT
USNA 2023-05-23 1.2 2.7 18.5 8.8
USNA 2023-05-22 1.3 2.7 18.7 8.9
USNA 2023-05-19 1.3 2.7 19.0 9.1
USNA 2023-05-18 1.3 2.7 18.8 9.0
USNA 2023-05-17 1.3 2.7 18.7 8.9
USNA 2023-05-16 1.3 2.7 18.9 9.0

USNA Growth Metrics

    Its 2 year net cashflow from operations growth rate is now at -20.22%.
  • Its 5 year cash and equivalents growth rate is now at 10.08%.
  • Its 4 year net income to common stockholders growth rate is now at 3.84%.
USNA's revenue has moved down $125,399,000 over the prior 49 months.

The table below shows USNA's growth in key financial areas (numbers in millions of US dollars).

Date Revenue Operating Cash Flow Net Income to Common Stock
2022-09-30 1,037.94 88.361 76.875
2022-06-30 1,078.992 96.724 89.276
2022-03-31 1,151.355 121.269 108.353
2021-12-31 1,186.464 121.227 116.505
2021-09-30 1,229.686 144.22 135.814
2021-06-30 1,253.847 155.794 138.99

USNA's Quality Factors

The “Quality” component of the POWR Ratings focuses on 31 different factors of a companies fundamentals and operational strength. Here are some key insights as we drill into the specifics of these quality attributes.
  • USNA has a Quality Grade of A, ranking ahead of 99.94% of graded US stocks.
  • USNA's asset turnover comes in at 2.095 -- ranking 5th of 681 Pharmaceutical Products stocks.
  • RGLS, ANIP, and VTVT are the stocks whose asset turnover ratios are most correlated with USNA.

The table below shows USNA's key quality metrics over time.

Period Asset Turnover Gross Margin ROIC
2021-07-03 2.095 0.817 1.727
2021-04-03 2.032 0.812 1.699
2021-01-02 2.059 0.816 1.726
2020-09-26 2.106 0.820 1.707
2020-06-27 2.152 0.821 1.560
2020-03-28 2.124 0.822 1.401

USANA Health Sciences, Inc. (USNA) Company Bio


USANA Health Sciences develops and manufactures nutritional supplements, healthy foods and personal care products. The company was founded in 1992 and is based in Salt Lake City, Utah.


USNA Latest News Stream


Event/Time News Detail
Loading, please wait...

USNA Latest Social Stream


Loading social stream, please wait...

View Full USNA Social Stream

Latest USNA News From Around the Web

Below are the latest news stories about USANA HEALTH SCIENCES INC that investors may wish to consider to help them evaluate USNA as an investment opportunity.

Kevin Guest Shares Insights for June Effective Communications Month

In recognition of National Effective Communications Month in June, USANA Health Sciences Chairman and CEO Kevin Guest shares his admiration for the power of effective communication in business and personal life.

Yahoo | June 1, 2023

USANA partners with Promise2Live for global suicide prevention campaign

More than 800,000 people take their life by suicide each year around the world and it is the second leading cause of death for people 10­–34 years old. These sobering numbers are evidence of a global mental health crisis. As an international company focused on health and wellness, USANA has made the promise to stop the stigma, start conversations, and save lives by partnering with Good Deed Revolution and their Promise2Live campaign.

Yahoo | May 30, 2023

Investors in USANA Health Sciences (NYSE:USNA) have unfortunately lost 47% over the last five years

In order to justify the effort of selecting individual stocks, it's worth striving to beat the returns from a market...

Yahoo | May 30, 2023

Utah Company Brings Home Five Awards from Local Organization

USANA, a leader in global nutrition, was honored at the Best of State Gala in Salt Lake City, Utah, for its excellence in product quality and innovation. The company brought home prominent awards for its manufacturing department, Celavive, Rev3 Energy, CellSentials, and its Nutritional product line.

Yahoo | May 25, 2023

USANA Executive Director honored at Utah event

USANA is proud to announce Executive Director of Research and Development Rachel Brewer, Ph.D., as one of Utah Business magazine's 30 Women to Watch. The award recognizes the state's movers and shakers who are starting, managing, growing, or otherwise furthering the work of their companies—enhancing Utah's future with a strong female impact.

Yahoo | May 24, 2023

Read More 'USNA' Stories Here

USNA Price Returns

1-mo -2.60%
3-mo 6.10%
6-mo 22.96%
1-year -12.52%
3-year -24.00%
5-year -46.13%
YTD 19.70%
2022 -47.43%
2021 31.26%
2020 -1.85%
2019 -33.28%
2018 58.99%

Get Free Updates

Join thousands of investors who get the latest news, insights and top rated picks from StockNews.com!