
Universal Technical Institute Inc (UTI): Price and Financial Metrics
UTI Price/Volume Stats
| Current price | $19.43 | 52-week high | $19.50 |
| Prev. close | $18.69 | 52-week low | $7.06 |
| Day low | $18.98 | Volume | 479,934 |
| Day high | $19.50 | Avg. volume | 616,124 |
| 50-day MA | $15.83 | Dividend yield | N/A |
| 200-day MA | $13.74 | Market Cap | 1.05B |
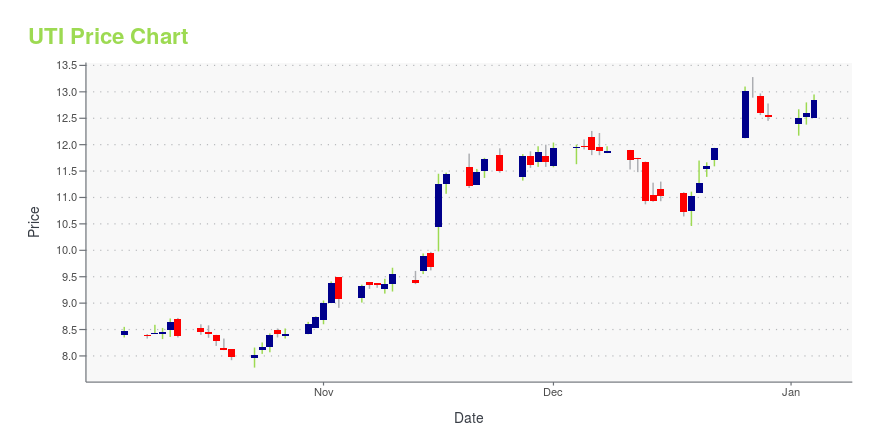
UTI Stock Price Chart Interactive Chart >
Universal Technical Institute Inc (UTI) Company Bio
Universal Technical Institute Inc., through its Universal Technical Institute (UTI) campuses, provides technical education training. The Schools, through its UTI campuses, offers automotive, collision repair and refinishing, and diesel training. UTI also offers training in motorcycle, marine, and personal watercraft through its Motorcycle and Marine Mechanics Institutes(MMI).
Latest UTI News From Around the Web
Below are the latest news stories about UNIVERSAL TECHNICAL INSTITUTE INC that investors may wish to consider to help them evaluate UTI as an investment opportunity.
Strength Seen in Universal Technical (UTI): Can Its 9.1% Jump Turn into More Strength?Universal Technical (UTI) witnessed a jump in share price last session on above-average trading volume. The latest trend in earnings estimate revisions for the stock doesn't suggest further strength down the road. |
Universal Technical Institute, Inc.'s (NYSE:UTI) Stock On An Uptrend: Could Fundamentals Be Driving The Momentum?Most readers would already be aware that Universal Technical Institute's (NYSE:UTI) stock increased significantly by... |
Concorde Career Colleges accelerates efforts to address growing demand for healthcare workersConcorde Career Colleges today announced the launch of additional program offerings in dental hygiene and sonography, accelerating the institution's efforts to address the growing demand for allied health professionals. Concorde is the healthcare division of Universal Technical Institute, Inc. ("UTI") |
Universal Technical Institute, Inc. Announces Conversion of All Series A Preferred Stock into Common StockUniversal Technical Institute, Inc. (NYSE: UTI) (the "Company"), a leading workforce solutions provider of transportation, skilled trades and healthcare education programs, today announced that it achieved the Company conversion option and thus has effected the conversion of all the Company's Series A Preferred Stock into Common Stock, effective December 18, 2023. The Company's outstanding Common Stock increases by 19.3 million shares as a result of the conversion. |
Universal Technical Institute, Inc. announces Kevin Prehn as president of Concorde Career CollegesUniversal Technical Institute, Inc. (NYSE: UTI), a leading workforce solutions provider of transportation, skilled trades, and healthcare education programs, today announced the appointment of Kevin Prehn as president of Concorde Career Colleges, effective immediately. Prehn has served as interim president since September. |
UTI Price Returns
| 1-mo | 30.75% |
| 3-mo | 27.83% |
| 6-mo | 27.91% |
| 1-year | 170.61% |
| 3-year | 227.10% |
| 5-year | 427.99% |
| YTD | 55.19% |
| 2023 | 86.31% |
| 2022 | -14.07% |
| 2021 | 21.05% |
| 2020 | -16.21% |
| 2019 | 111.23% |
Continue Researching UTI
Want to do more research on Universal Technical Institute Inc's stock and its price? Try the links below:Universal Technical Institute Inc (UTI) Stock Price | Nasdaq
Universal Technical Institute Inc (UTI) Stock Quote, History and News - Yahoo Finance
Universal Technical Institute Inc (UTI) Stock Price and Basic Information | MarketWatch
Loading social stream, please wait...