Vale S.A. ADR (VALE): Price and Financial Metrics
VALE Price/Volume Stats
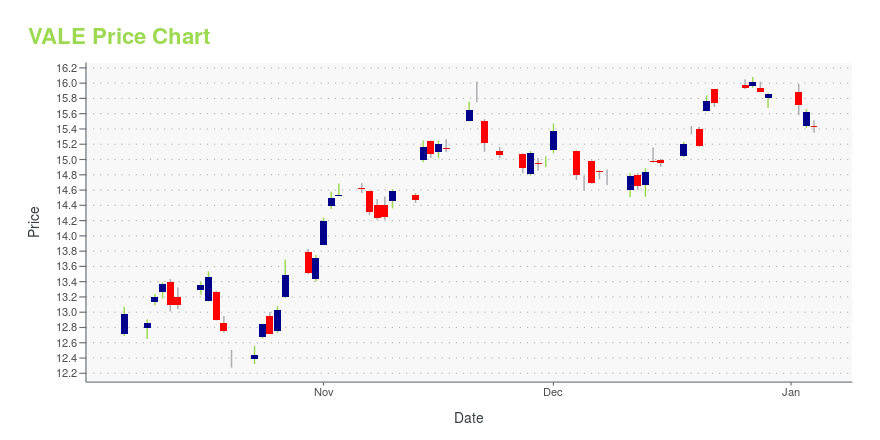
Current price | $13.75 | 52-week high | $19.31 |
Prev. close | $13.65 | 52-week low | $12.22 |
Day low | $13.74 | Volume | 16,408,500 |
Day high | $13.99 | Avg. volume | 22,295,703 |
50-day MA | $13.65 | Dividend yield | 4.84% |
200-day MA | $15.09 | Market Cap | 61.64B |
VALE Stock Price Chart Interactive Chart >
VALE POWR Grades
- Quality is the dimension where VALE ranks best; there it ranks ahead of 95.54% of US stocks.
- VALE's strongest trending metric is Growth; it's been moving down over the last 179 days.
- VALE ranks lowest in Growth; there it ranks in the 9th percentile.
VALE Stock Summary
- VALE has a market capitalization of $67,430,127,332 -- more than approximately 96.64% of US stocks.
- With a price/earnings ratio of 3.59, VALE SA P/E ratio is greater than that of about only 4.06% of stocks in our set with positive earnings.
- Of note is the ratio of VALE SA's sales and general administrative expense to its total operating expenses; merely 7.44% of US stocks have a lower such ratio.
- Stocks that are quantitatively similar to VALE, based on their financial statements, market capitalization, and price volatility, are PCAR, OXY, MELI, EQNR, and TAK.
- VALE's SEC filings can be seen here. And to visit VALE SA's official web site, go to www.vale.com.
VALE Valuation Summary
- In comparison to the median Basic Materials stock, VALE's price/earnings ratio is 78.59% lower, now standing at 3.5.
- VALE's price/sales ratio has moved down 2.2 over the prior 243 months.
Below are key valuation metrics over time for VALE.
Stock | Date | P/S | P/B | P/E | EV/EBIT |
---|---|---|---|---|---|
VALE | 2023-09-06 | 1.5 | 1.8 | 3.5 | 3.4 |
VALE | 2023-09-05 | 1.5 | 1.8 | 3.5 | 3.4 |
VALE | 2023-09-01 | 1.5 | 1.9 | 3.6 | 3.5 |
VALE | 2023-08-31 | 1.4 | 1.8 | 3.3 | 3.3 |
VALE | 2023-08-30 | 1.5 | 1.8 | 3.4 | 3.3 |
VALE | 2023-08-29 | 1.5 | 1.8 | 3.4 | 3.3 |
VALE Growth Metrics
- The 5 year revenue growth rate now stands at 17.81%.
- The 5 year net income to common stockholders growth rate now stands at -11.37%.
- The 2 year cash and equivalents growth rate now stands at 133.18%.

The table below shows VALE's growth in key financial areas (numbers in millions of US dollars).
Date | Revenue | Operating Cash Flow | Net Income to Common Stock |
---|---|---|---|
2021-12-31 | 54,502 | 33,414 | 22,445 |
2020-12-31 | 40,018 | 17,030 | 4,881 |
2019-12-31 | 37,570 | 15,608 | -1,683 |
2018-12-31 | 36,575 | 12,901 | 6,860 |
2017-12-31 | 33,967 | 12,450 | 5,507 |
VALE's Quality Factors
The “Quality” component of the POWR Ratings focuses on 31 different factors of a companies fundamentals and operational strength. Here are some key insights as we drill into the specifics of these quality attributes.- VALE has a Quality Grade of A, ranking ahead of 98.37% of graded US stocks.
- VALE's asset turnover comes in at 0.436 -- ranking 17th of 42 Non-Metallic and Industrial Metal Mining stocks.
- 500 - Internal server error
The table below shows VALE's key quality metrics over time.
Period | Asset Turnover | Gross Margin | ROIC |
---|---|---|---|
2020-12-31 | 0.436 | 0.524 | 0.107 |
2019-12-31 | 0.418 | 0.436 | 0.018 |
2018-12-31 | 0.390 | 0.396 | 0.097 |
2017-12-31 | 0.343 | 0.381 | 0.128 |
2016-12-31 | 0.293 | 0.358 | 0.124 |
2015-12-31 | 0.250 | 0.199 | 0.013 |
Vale S.A. ADR (VALE) Company Bio
Vale S.A engages in the research, production, and sale of iron ore and pellets, nickel, fertilizer, copper, coal, manganese, ferroalloys, cobalt, platinum group metals, and precious metals in Brazil and internationally. The company was founded in 1942 and is based in Rio de Janeiro, Brazil.
Latest VALE News From Around the Web
Below are the latest news stories about VALE SA that investors may wish to consider to help them evaluate VALE as an investment opportunity.
3 Dividend Stocks for 100% Total Returns by 2025Looking for undervalued dividend stocks to buy? |
VALE S.A. (VALE) Gains As Market Dips: What You Should KnowIn the latest trading session, VALE S.A. (VALE) closed at $14.12, marking a +0.07% move from the previous day. |
3 Bargain Blue-Chip Stocks to Buy Under $20These are the blue-chip stocks to buy at undervalued levels for robust returns in the next 24 months. |
VALE S.A. (VALE) Dips More Than Broader Markets: What You Should KnowVALE S.A. (VALE) closed the most recent trading day at $13.60, moving -0.66% from the previous trading session. |
Iron Ore Giant Vale Says China Property Outlook Is More Encouraging(Bloomberg) -- No. 2 iron ore miner Vale SA said the outlook for China’s steel-intensive property sector is “more encouraging” despite uncertainties, and reiterated its long-term view of the global steel market remains intact.Most Read from BloombergChina Slowdown Means It May Never Overtake US Economy, Forecast ShowsHuawei Teardown Shows Chip Breakthrough in Blow to US SanctionsReturn-to-Office Is a $1.3 Trillion Problem Few Have Figured OutBillion-Dollar Corporate Bond Deals Hit Treasuries: Ma |
VALE Price Returns
1-mo | 7.93% |
3-mo | 1.37% |
6-mo | -9.67% |
1-year | 10.85% |
3-year | 68.40% |
5-year | 26.18% |
YTD | -15.08% |
2022 | 29.63% |
2021 | -1.97% |
2020 | 29.89% |
2019 | 2.31% |
2018 | 11.26% |
VALE Dividends
Ex-Dividend Date | Type | Payout Amount | Change | ||||||
---|---|---|---|---|---|---|---|---|---|
Loading, please wait... |
Continue Researching VALE
Here are a few links from around the web to help you further your research on Vale SA's stock as an investment opportunity:Vale SA (VALE) Stock Price | Nasdaq
Vale SA (VALE) Stock Quote, History and News - Yahoo Finance
Vale SA (VALE) Stock Price and Basic Information | MarketWatch
Loading social stream, please wait...