Visteon Corporation (VC): Price and Financial Metrics
VC Price/Volume Stats
Current price | $149.15 | 52-week high | $171.66 |
Prev. close | $148.66 | 52-week low | $94.71 |
Day low | $147.17 | Volume | 229,300 |
Day high | $149.77 | Avg. volume | 313,880 |
50-day MA | $142.01 | Dividend yield | N/A |
200-day MA | $140.24 | Market Cap | 4.23B |
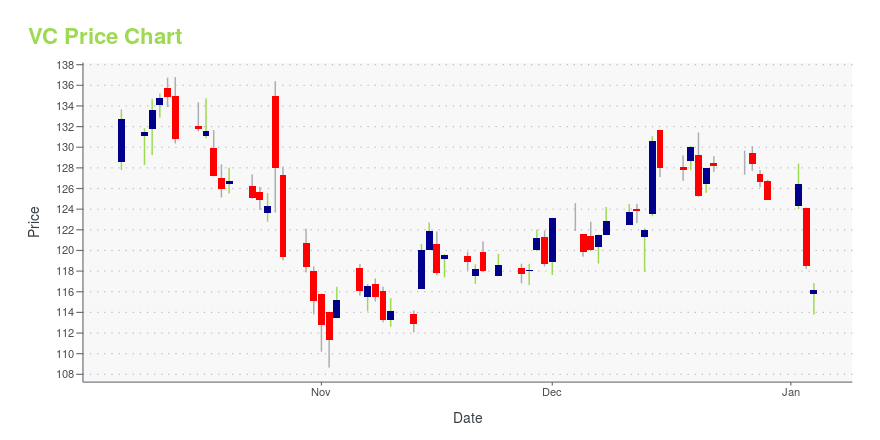
VC Stock Price Chart Interactive Chart >
VC POWR Grades
- Growth is the dimension where VC ranks best; there it ranks ahead of 97.93% of US stocks.
- The strongest trend for VC is in Momentum, which has been heading up over the past 179 days.
- VC's current lowest rank is in the Value metric (where it is better than 32.95% of US stocks).
VC Stock Summary
- The capital turnover (annual revenue relative to shareholder's equity) for VC is 5.42 -- better than 91.72% of US stocks.
- Over the past twelve months, VC has reported earnings growth of 141.67%, putting it ahead of 90.34% of US stocks in our set.
- As for revenue growth, note that VC's revenue has grown 37.26% over the past 12 months; that beats the revenue growth of 82.93% of US companies in our set.
- Stocks with similar financial metrics, market capitalization, and price volatility to VISTEON CORP are MTG, SGA, ESP, BHE, and PRPO.
- Visit VC's SEC page to see the company's official filings. To visit the company's web site, go to www.visteon.com.
VC Valuation Summary
- VC's EV/EBIT ratio is 19.3; this is 39.35% higher than that of the median Consumer Cyclical stock.
- Over the past 154 months, VC's price/sales ratio has gone NA NA.
Below are key valuation metrics over time for VC.
Stock | Date | P/S | P/B | P/E | EV/EBIT |
---|---|---|---|---|---|
VC | 2023-05-19 | 1 | 5.5 | 28.9 | 19.3 |
VC | 2023-05-18 | 1 | 5.5 | 29.1 | 19.5 |
VC | 2023-05-17 | 1 | 5.5 | 29.2 | 19.5 |
VC | 2023-05-16 | 1 | 5.2 | 27.6 | 18.4 |
VC | 2023-05-15 | 1 | 5.3 | 28.2 | 18.8 |
VC | 2023-05-12 | 1 | 5.3 | 28.1 | 18.8 |
VC Growth Metrics
- The 5 year net income to common stockholders growth rate now stands at -82.35%.
- Its 4 year price growth rate is now at -41.44%.
- Its 5 year revenue growth rate is now at -10.03%.

The table below shows VC's growth in key financial areas (numbers in millions of US dollars).
Date | Revenue | Operating Cash Flow | Net Income to Common Stock |
---|---|---|---|
2022-12-31 | 3,756 | 167 | 124 |
2022-09-30 | 3,478 | 72 | 121 |
2022-06-30 | 3,083 | -15 | 82 |
2022-03-31 | 2,845 | 26 | 47 |
2021-12-31 | 2,773 | 58 | 41 |
2021-09-30 | 2,774 | 59 | 28 |
VC's Quality Factors
The “Quality” component of the POWR Ratings focuses on 31 different factors of a companies fundamentals and operational strength. Here are some key insights as we drill into the specifics of these quality attributes.- VC has a Quality Grade of C, ranking ahead of 50.47% of graded US stocks.
- VC's asset turnover comes in at 1.287 -- ranking 21st of 68 Automobiles and Trucks stocks.
- GM, CVGI, and DAN are the stocks whose asset turnover ratios are most correlated with VC.
The table below shows VC's key quality metrics over time.
Period | Asset Turnover | Gross Margin | ROIC |
---|---|---|---|
2021-09-30 | 1.287 | 0.088 | 0.051 |
2021-06-30 | 1.324 | 0.102 | 0.061 |
2021-03-31 | 1.188 | 0.100 | 0.032 |
2020-12-31 | 1.103 | 0.096 | -0.008 |
2020-09-30 | 1.084 | 0.104 | 0.003 |
2020-06-30 | 1.077 | 0.098 | 0.008 |
VC Price Target
For more insight on analysts targets of VC, see our VC price target page. And for a list of of all stocks sorted by upside potential based on analyst target price, see our Top Price Target page.
Average Price Target | $125.71 | Average Broker Recommendation | 1.84 (Hold) |
Visteon Corporation (VC) Company Bio
Visteon Corporation is a global technology company that designs, engineers and manufactures innovative cockpit electronics products and connected car solutions for most of the world's major vehicle manufacturers. The company was founded in 2000 and is based in Van Buren Township, Michigan.
Latest VC News From Around the Web
Below are the latest news stories about VISTEON CORP that investors may wish to consider to help them evaluate VC as an investment opportunity.
Are Options Traders Betting on a Big Move in Visteon (VC) Stock?Investors need to pay close attention to Visteon (VC) stock based on the movements in the options market lately. |
Slowing Rates Of Return At Visteon (NASDAQ:VC) Leave Little Room For ExcitementFinding a business that has the potential to grow substantially is not easy, but it is possible if we look at a few key... |
Q1 2023 Visteon Corp Earnings CallQ1 2023 Visteon Corp Earnings Call |
Visteon (VC) Misses Q1 Earnings EstimatesVisteon (VC) delivered earnings and revenue surprises of -8.09% and 1.85%, respectively, for the quarter ended March 2023. Do the numbers hold clues to what lies ahead for the stock? |
Visteon Announces First-Quarter 2023 ResultsVAN BUREN TOWNSHIP, Mich., April 27, 2023 (GLOBE NEWSWIRE) -- Visteon Corporation (NASDAQ: VC) today reported first quarter financial results. Highlights include: Sales of $967 million, up 22%1 from prior year16th consecutive quarter of growth-over-marketNet income of $34 millionAdjusted EBITDA of $99 million or 10.2% of sales$1.5 billion in new business wins$135 million in net cash at quarter end Visteon reported net sales of $967 million, representing a year-over-year increase of 22% excluding |
VC Price Returns
1-mo | 9.33% |
3-mo | -6.87% |
6-mo | 5.04% |
1-year | 39.68% |
3-year | 96.04% |
5-year | 13.42% |
YTD | 14.00% |
2022 | 17.72% |
2021 | -11.46% |
2020 | 44.96% |
2019 | 43.65% |
2018 | -51.83% |
Continue Researching VC
Here are a few links from around the web to help you further your research on Visteon Corp's stock as an investment opportunity:Visteon Corp (VC) Stock Price | Nasdaq
Visteon Corp (VC) Stock Quote, History and News - Yahoo Finance
Visteon Corp (VC) Stock Price and Basic Information | MarketWatch
Loading social stream, please wait...