Vera Bradley, Inc. (VRA): Price and Financial Metrics
GET POWR RATINGS... FREE!
VRA POWR Grades
- VRA scores best on the Sentiment dimension, with a Sentiment rank ahead of 96.68% of US stocks.
- The strongest trend for VRA is in Growth, which has been heading up over the past 177 days.
- VRA ranks lowest in Stability; there it ranks in the 18th percentile.
VRA Stock Summary
- VRA's price/sales ratio is 0.37; that's higher than the P/S ratio of only 10.26% of US stocks.
- In terms of twelve month growth in earnings before interest and taxes, VERA BRADLEY INC is reporting a growth rate of -221.74%; that's higher than just 7.04% of US stocks.
- VERA BRADLEY INC's shareholder yield -- a measure of how much capital is returned to stockholders via dividends and buybacks -- is 12.47%, greater than the shareholder yield of 87.66% of stocks in our set.
- Stocks with similar financial metrics, market capitalization, and price volatility to VERA BRADLEY INC are IPW, SSY, TCS, WHLM, and STC.
- Visit VRA's SEC page to see the company's official filings. To visit the company's web site, go to www.verabradley.com.
VRA Valuation Summary
- VRA's price/sales ratio is 0.3; this is 66.67% lower than that of the median Consumer Cyclical stock.
- VRA's EV/EBIT ratio has moved down 30.6 over the prior 149 months.
Below are key valuation metrics over time for VRA.
Stock | Date | P/S | P/B | P/E | EV/EBIT |
---|---|---|---|---|---|
VRA | 2023-01-26 | 0.3 | 0.6 | -6.4 | -8.1 |
VRA | 2023-01-25 | 0.3 | 0.6 | -6.4 | -8.1 |
VRA | 2023-01-24 | 0.3 | 0.6 | -6.4 | -8.1 |
VRA | 2023-01-23 | 0.3 | 0.6 | -6.6 | -8.2 |
VRA | 2023-01-20 | 0.3 | 0.6 | -6.6 | -8.2 |
VRA | 2023-01-19 | 0.3 | 0.6 | -6.4 | -8.1 |
VRA Growth Metrics
- Its 4 year cash and equivalents growth rate is now at 10.6%.
- The 3 year net income to common stockholders growth rate now stands at -34.04%.
- The year over year cash and equivalents growth rate now stands at 24.56%.

The table below shows VRA's growth in key financial areas (numbers in millions of US dollars).
Date | Revenue | Operating Cash Flow | Net Income to Common Stock |
---|---|---|---|
2022-09-30 | 502.446 | -16.108 | -26.419 |
2022-06-30 | 513.141 | -3.744 | -25.808 |
2022-03-31 | 529.818 | 38.819 | 13.009 |
2021-12-31 | 540.453 | 39.861 | 17.838 |
2021-09-30 | 533.246 | 38.283 | 20.611 |
2021-06-30 | 523.36 | 37.266 | 23.707 |
VRA's Quality Factors
The “Quality” component of the POWR Ratings focuses on 31 different factors of a companies fundamentals and operational strength. Here are some key insights as we drill into the specifics of these quality attributes.- VRA has a Quality Grade of B, ranking ahead of 94.66% of graded US stocks.
- VRA's asset turnover comes in at 1.006 -- ranking 17th of 32 Apparel stocks.
- CAL, SKX, and CPRI are the stocks whose asset turnover ratios are most correlated with VRA.
The table below shows VRA's key quality metrics over time.
Period | Asset Turnover | Gross Margin | ROIC |
---|---|---|---|
2021-07-31 | 1.006 | 0.556 | 0.072 |
2021-05-01 | 0.969 | 0.572 | 0.080 |
2021-01-30 | 0.872 | 0.567 | 0.025 |
2020-10-31 | 0.890 | 0.567 | 0.044 |
2020-08-01 | 0.899 | 0.552 | 0.017 |
2020-05-02 | 0.872 | 0.540 | -0.002 |
VRA Price Target
For more insight on analysts targets of VRA, see our VRA price target page. And for a list of of all stocks sorted by upside potential based on analyst target price, see our Top Price Target page.
Average Price Target | $13.50 | Average Broker Recommendation | 1.9 (Hold) |
VRA Stock Price Chart Interactive Chart >
VRA Price/Volume Stats
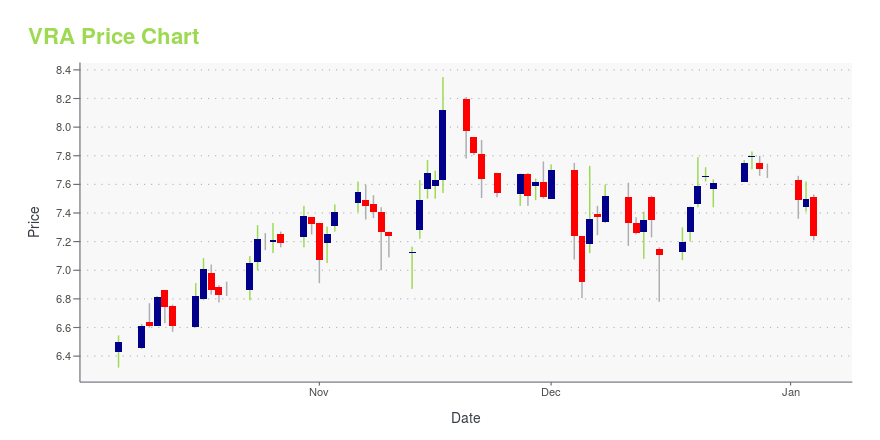
Current price | $5.68 | 52-week high | $8.49 |
Prev. close | $5.70 | 52-week low | $2.84 |
Day low | $5.48 | Volume | 164,414 |
Day high | $5.87 | Avg. volume | 240,923 |
50-day MA | $4.84 | Dividend yield | N/A |
200-day MA | $4.53 | Market Cap | 175.38M |
Vera Bradley, Inc. (VRA) Company Bio
Vera Bradley, Inc. designs, manufactures, and sells handbags, accessories, and luggage and travel items for women of all ages under the Vera Bradley brand. The company was founded in 1982 and is based in Roanoke, Indiana.
Latest VRA News From Around the Web
Below are the latest news stories about VERA BRADLEY INC that investors may wish to consider to help them evaluate VRA as an investment opportunity.
Vera Bradley Announces Reporting Date For Fourth Quarter And Fiscal Year 2023 ResultsFORT WAYNE, Ind., Feb. 01, 2023 (GLOBE NEWSWIRE) -- Vera Bradley, Inc. (Nasdaq: VRA) (“Vera Bradley” or the “Company”) today announced that it plans to report results for the fourth quarter and fiscal year ended January 28, 2023 at 8:00 a.m. Eastern Time on Wednesday, March 8, 2023. The Company will host a conference call to discuss its financial results at 9:30 a.m. Eastern Time that same day. A live webcast of the conference call will be available on the Investor Relations section of the Compa |
Vera Bradley To Host Annual Outlet Sale In Fort Wayne This JuneEvent tickets available beginning March 28, 2023FORT WAYNE, Ind., Jan. 31, 2023 (GLOBE NEWSWIRE) -- Vera Bradley, Inc. (NASDAQ: VRA) today announced that Vera Bradley, its iconic American bag and luggage lifestyle brand, will host its 37th Annual Outlet Sale event at the Allen County War Memorial Coliseum in Fort Wayne, Ind. from June 14 – June 18, 2023, back by popular demand following a three-year hiatus due to the COVID-19 pandemic. Tickets for the Vera Bradley Annual Outlet Sale (the “Sale”) |
After 3 Months at the Helm, Vera Bradley CEO Jackie Ardrey Shakes Up Executive TeamDaren Hull, Beatrice Mac Cabe and Mary Beth Trypus have all left the company. |
Vera Bradley Announces Streamlined Leadership StructureSimplified structure designed to drive cost savings, add marketing and merchandising focus, and fuel long-term profitable growth Company announces elimination of Vera Bradley Brand President, Chief Creative Officer, and Chief Revenue Officer positions and resignations of Pura Vida Co-Presidents Goodman and Thall; Thall to remain in consulting role Hiatt named to new post of Vera Bradley, Inc. Chief Marketing Officer FORT WAYNE, Ind., Jan. 24, 2023 (GLOBE NEWSWIRE) -- Vera Bradley, Inc. (Nasdaq: |
Vera Bradley – Consensus Indicates Potential 31.6% UpsideVera Bradley found using ticker (VRA) now have 3 analysts covering the stock. The analyst consensus points to a rating of ''Buy''. The target price ranges between 9 and 4.5 with the average target price sitting at 7.17. Given that the stocks previous close was at 5.45 this now indicates there is a potential upside of 31.6%. The 50 day MA is 4.36 while the 200 day moving average is 4.6. The company has a market capitalisation of $174m. Company Website: https://www.verabradley.com [stock_market_widget type="chart" template="basic" color="green" assets="VRA" range="6mo" interval="1d" axes="true" cursor="true" api="yf"] The potential market cap would be $229m based on the market concensus. Vera Bradley, together with its subsidiaries, designs, manufactures, and sells women''s handbags, lugg... |
VRA Price Returns
1-mo | 13.37% |
3-mo | 72.64% |
6-mo | 23.48% |
1-year | -29.70% |
3-year | -41.50% |
5-year | -40.52% |
YTD | 25.39% |
2022 | -46.77% |
2021 | 6.91% |
2020 | -32.54% |
2019 | 37.69% |
2018 | -29.64% |
Continue Researching VRA
Here are a few links from around the web to help you further your research on Vera Bradley Inc's stock as an investment opportunity:Vera Bradley Inc (VRA) Stock Price | Nasdaq
Vera Bradley Inc (VRA) Stock Quote, History and News - Yahoo Finance
Vera Bradley Inc (VRA) Stock Price and Basic Information | MarketWatch
Loading social stream, please wait...