VeriSign Inc. (VRSN): Price and Financial Metrics
GET POWR RATINGS... FREE!
VRSN POWR Grades
- VRSN scores best on the Quality dimension, with a Quality rank ahead of 99.74% of US stocks.
- VRSN's strongest trending metric is Growth; it's been moving down over the last 177 days.
- VRSN's current lowest rank is in the Momentum metric (where it is better than 7.03% of US stocks).
VRSN Stock Summary
- The capital turnover (annual revenue relative to shareholder's equity) for VRSN is -0.91 -- better than merely 5.19% of US stocks.
- With a price/sales ratio of 16.55, VERISIGN INC has a higher such ratio than 93.06% of stocks in our set.
- VRSN's equity multiplier -- a measure of assets relative to shareholders'equity -- is greater than that of merely 5.26% of US stocks.
- Stocks with similar financial metrics, market capitalization, and price volatility to VERISIGN INC are FICO, NTNX, ONVO, MNTV, and ASAN.
- VRSN's SEC filings can be seen here. And to visit VERISIGN INC's official web site, go to www.verisign.com.
VRSN Valuation Summary
- In comparison to the median Technology stock, VRSN's price/sales ratio is 578.26% higher, now standing at 15.6.
- Over the past 243 months, VRSN's price/sales ratio has gone up 13.6.
Below are key valuation metrics over time for VRSN.
Stock | Date | P/S | P/B | P/E | EV/EBIT |
---|---|---|---|---|---|
VRSN | 2023-01-06 | 15.6 | -14.1 | 26.4 | 24.8 |
VRSN | 2023-01-05 | 15.2 | -13.7 | 25.7 | 24.2 |
VRSN | 2023-01-04 | 15.6 | -14.1 | 26.4 | 24.8 |
VRSN | 2023-01-03 | 15.3 | -13.9 | 26.0 | 24.4 |
VRSN | 2022-12-30 | 15.6 | -14.1 | 26.4 | 24.8 |
VRSN | 2022-12-29 | 15.6 | -14.1 | 26.4 | 24.8 |
VRSN Growth Metrics
- Its 5 year price growth rate is now at 140.6%.
- Its 4 year net cashflow from operations growth rate is now at 11.02%.
- Its 3 year cash and equivalents growth rate is now at -2.71%.

The table below shows VRSN's growth in key financial areas (numbers in millions of US dollars).
Date | Revenue | Operating Cash Flow | Net Income to Common Stock |
---|---|---|---|
2022-09-30 | 1,396.008 | 820.443 | 824.382 |
2022-06-30 | 1,373.35 | 818.308 | 811.504 |
2022-03-31 | 1,350.855 | 815.916 | 791.976 |
2021-12-31 | 1,327.576 | 807.152 | 784.83 |
2021-09-30 | 1,307.552 | 796.13 | 612.062 |
2021-06-30 | 1,291.189 | 675.655 | 626.419 |
VRSN's Quality Factors
The “Quality” component of the POWR Ratings focuses on 31 different factors of a companies fundamentals and operational strength. Here are some key insights as we drill into the specifics of these quality attributes.- VRSN has a Quality Grade of A, ranking ahead of 99.71% of graded US stocks.
- VRSN's asset turnover comes in at 0.736 -- ranking 210th of 563 Business Services stocks.
- MIME, BNFT, and FIVN are the stocks whose asset turnover ratios are most correlated with VRSN.
The table below shows VRSN's key quality metrics over time.
Period | Asset Turnover | Gross Margin | ROIC |
---|---|---|---|
2021-09-30 | 0.736 | 0.856 | 0.382 |
2021-06-30 | 0.732 | 0.856 | 0.370 |
2021-03-31 | 0.716 | 0.858 | 0.373 |
2020-12-31 | 0.712 | 0.858 | 0.384 |
2020-09-30 | 0.698 | 0.856 | 0.385 |
2020-06-30 | 0.681 | 0.855 | 0.381 |
VRSN Price Target
For more insight on analysts targets of VRSN, see our VRSN price target page. And for a list of of all stocks sorted by upside potential based on analyst target price, see our Top Price Target page.
Average Price Target | $252.25 | Average Broker Recommendation | 1.5 (Moderate Buy) |
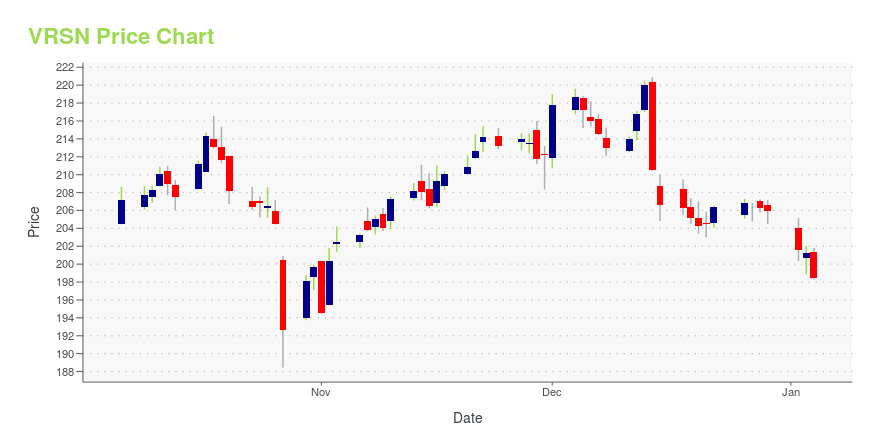
VRSN Stock Price Chart Interactive Chart >
VRSN Price/Volume Stats
Current price | $217.89 | 52-week high | $228.80 |
Prev. close | $214.95 | 52-week low | $155.25 |
Day low | $215.75 | Volume | 351,600 |
Day high | $217.95 | Avg. volume | 572,824 |
50-day MA | $203.38 | Dividend yield | N/A |
200-day MA | $187.70 | Market Cap | 23.10B |
VeriSign Inc. (VRSN) Company Bio
Verisign Inc. is an American company based in Reston, Virginia, United States that operates a diverse array of network infrastructure, including two of the Internet's thirteen root nameservers, the authoritative registry for the .com, .net, and .name generic top-level domains and the .cc and .tv country-code top-level domains, and the back-end systems for the .jobs, .gov, and .edu Sponsored top-level domains. Verisign also offers a range of security services, including managed DNS, distributed denial-of-service (DDoS) attack mitigation and cyber-threat reporting. (Source:Wikipedia)
Latest VRSN News From Around the Web
Below are the latest news stories about VERISIGN INC that investors may wish to consider to help them evaluate VRSN as an investment opportunity.
Is VeriSign, Inc. (NASDAQ:VRSN) Worth US$214 Based On Its Intrinsic Value?Does the January share price for VeriSign, Inc. ( NASDAQ:VRSN ) reflect what it's really worth? Today, we will estimate... |
VeriSign (VRSN) is a Top-Ranked Momentum Stock: Should You Buy?Whether you're a value, growth, or momentum investor, finding strong stocks becomes easier with the Zacks Style Scores, a top feature of the Zacks Premium research service. |
Verisign to Report Fourth Quarter and Full Year 2022 Financial ResultsRESTON, Va.--(BUSINESS WIRE)--VeriSign, Inc. (NASDAQ: VRSN), a global provider of domain name registry services and internet infrastructure, today announced that its earnings call for the fourth quarter and full year 2022, will take place on Thursday, Feb. 9, 2023, at 4:30 p.m. (EST). The earnings news release will be distributed to the wire services at approximately 4:05 p.m. (EST) that day and will also be available directly from the company’s website at https://investor.verisign.com. Verisig |
Was anything positive for VeriSign Inc. (VRSN) stock last session?VeriSign Inc. (NASDAQ:VRSN) marked $205.44 per share on Friday, up from a previous closing price of $205.38. While VeriSign Inc. has overperformed by 0.03%, investors are advised to look at stock chart patterns for technical insight. Within its last year performance, VRSN fell by -19.22%, with highs and lows ranging from $257.03 to $155.25, whereas […] |
VeriSign (VRSN) Stock: Wait For Better Signals (Technical Analysis)VeriSign’s correction in 2022 not the worst and on par with S&P 500 return. Read more to see my technical analysis on VRSN and why I think investors should wait. |
VRSN Price Returns
1-mo | 8.33% |
3-mo | 7.14% |
6-mo | 15.19% |
1-year | 5.04% |
3-year | 3.28% |
5-year | 88.96% |
YTD | 6.06% |
2022 | -19.06% |
2021 | 17.29% |
2020 | 12.31% |
2019 | 29.93% |
2018 | 29.58% |
Continue Researching VRSN
Want to see what other sources are saying about Verisign Inc's financials and stock price? Try the links below:Verisign Inc (VRSN) Stock Price | Nasdaq
Verisign Inc (VRSN) Stock Quote, History and News - Yahoo Finance
Verisign Inc (VRSN) Stock Price and Basic Information | MarketWatch
Loading social stream, please wait...