Versus Systems inc. (VS): Price and Financial Metrics
VS Price/Volume Stats
| Current price | $1.91 | 52-week high | $9.59 |
| Prev. close | $2.13 | 52-week low | $1.00 |
| Day low | $1.91 | Volume | 2,247,300 |
| Day high | $2.45 | Avg. volume | 515,173 |
| 50-day MA | $2.38 | Dividend yield | N/A |
| 200-day MA | $0.00 | Market Cap | 9.36M |
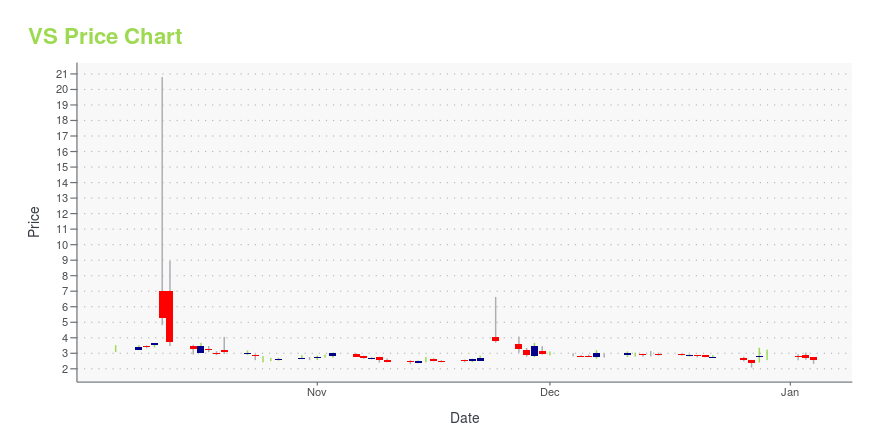
VS Stock Price Chart Interactive Chart >
Versus Systems inc. (VS) Company Bio
Versus Systems is the world leader in interactive audience engagement and rewards. “We work with content creators, teams, live events, and brands of all kinds — the Olympics, FIFA Worlds Cup, the Super Bowl, NFL, MLB, NBA, NHL, NCAA, even top gaming companies — to foster unprecedented fan engagement.” Their interactive experiences have been used at over 8,000 events averaging more than 1 million viewers a week.
VS Price Returns
| 1-mo | -26.82% |
| 3-mo | -3.36% |
| 6-mo | -6.83% |
| 1-year | 44.69% |
| 3-year | -98.31% |
| 5-year | -99.71% |
| YTD | -13.18% |
| 2024 | -27.39% |
| 2023 | -60.99% |
| 2022 | -98.46% |
| 2021 | -83.20% |
| 2020 | N/A |


Loading social stream, please wait...