Viad Corp (VVI): Price and Financial Metrics
VVI Price/Volume Stats
Current price | $26.38 | 52-week high | $44.25 |
Prev. close | $26.53 | 52-week low | $17.09 |
Day low | $25.70 | Volume | 99,188 |
Day high | $26.48 | Avg. volume | 133,479 |
50-day MA | $21.31 | Dividend yield | N/A |
200-day MA | $27.64 | Market Cap | 549.57M |
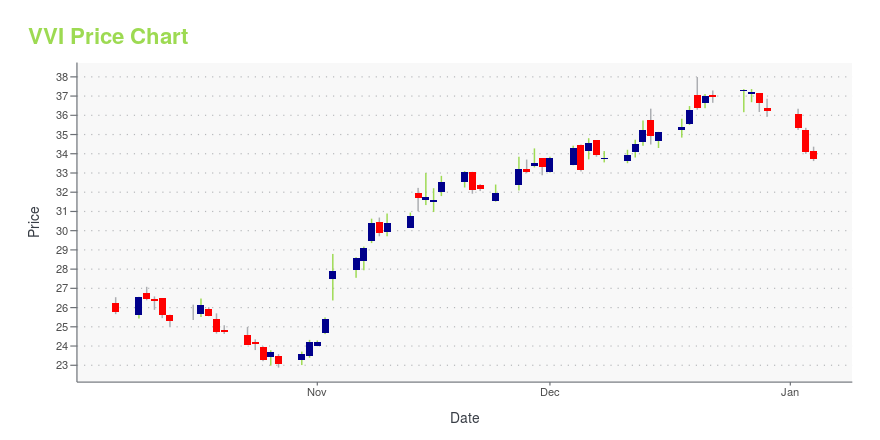
VVI Stock Price Chart Interactive Chart >
VVI POWR Grades
- VVI scores best on the Growth dimension, with a Growth rank ahead of 55.98% of US stocks.
- VVI's strongest trending metric is Quality; it's been moving down over the last 179 days.
- VVI's current lowest rank is in the Sentiment metric (where it is better than 17.08% of US stocks).
VVI Stock Summary
- Of note is the ratio of VIAD CORP's sales and general administrative expense to its total operating expenses; just 0.04% of US stocks have a lower such ratio.
- The ratio of debt to operating expenses for VIAD CORP is higher than it is for about merely 0% of US stocks.
- VVI's equity multiplier -- a measure of assets relative to shareholders'equity -- is greater than that of 99.94% of US stocks.
- Stocks with similar financial metrics, market capitalization, and price volatility to VIAD CORP are CRESY, NC, AFIB, ALEX, and OGEN.
- VVI's SEC filings can be seen here. And to visit VIAD CORP's official web site, go to www.viad.com.
VVI Valuation Summary
- VVI's price/earnings ratio is 16; this is 12.57% lower than that of the median Industrials stock.
- VVI's price/earnings ratio has moved up 11.8 over the prior 243 months.
Below are key valuation metrics over time for VVI.
Stock | Date | P/S | P/B | P/E | EV/EBIT |
---|---|---|---|---|---|
VVI | 2023-05-19 | 0.4 | -117.9 | 16.0 | 12.2 |
VVI | 2023-05-18 | 0.4 | -117.2 | 15.9 | 12.2 |
VVI | 2023-05-17 | 0.4 | -112.0 | 15.2 | 11.9 |
VVI | 2023-05-16 | 0.4 | -107.7 | 14.6 | 11.7 |
VVI | 2023-05-15 | 0.4 | -111.9 | 15.2 | 11.9 |
VVI | 2023-05-12 | 0.4 | -107.3 | 14.5 | 11.7 |
VVI Growth Metrics
- The year over year price growth rate now stands at -34.34%.
- The 4 year revenue growth rate now stands at 7.96%.
- Its year over year net cashflow from operations growth rate is now at 111.82%.

The table below shows VVI's growth in key financial areas (numbers in millions of US dollars).
Date | Revenue | Operating Cash Flow | Net Income to Common Stock |
---|---|---|---|
2022-09-30 | 1,062.857 | 70.346 | 8.439 |
2022-06-30 | 913.735 | 45.715 | -16.639 |
2022-03-31 | 655.765 | 12.79 | -78.504 |
2021-12-31 | 507.34 | -37.852 | -92.655 |
2021-09-30 | 349.339 | -37.055 | -120.584 |
2021-06-30 | 178.812 | -88.632 | -166.409 |
VVI's Quality Factors
The “Quality” component of the POWR Ratings focuses on 31 different factors of a companies fundamentals and operational strength. Here are some key insights as we drill into the specifics of these quality attributes.- VVI has a Quality Grade of D, ranking ahead of 12.76% of graded US stocks.
- VVI's asset turnover comes in at 0.2 -- ranking 489th of 563 Business Services stocks.
- INUV, INTU, and TRIP are the stocks whose asset turnover ratios are most correlated with VVI.
The table below shows VVI's key quality metrics over time.
Period | Asset Turnover | Gross Margin | ROIC |
---|---|---|---|
2021-06-30 | 0.200 | -0.728 | -0.160 |
2021-03-31 | 0.164 | -0.977 | -0.285 |
2020-12-31 | 0.419 | -0.280 | -0.368 |
2020-09-30 | 0.651 | -0.091 | -0.335 |
2020-06-30 | 0.842 | -0.004 | -0.265 |
2020-03-31 | 1.097 | 0.066 | -0.050 |
VVI Price Target
For more insight on analysts targets of VVI, see our VVI price target page. And for a list of of all stocks sorted by upside potential based on analyst target price, see our Top Price Target page.
Average Price Target | $58.00 | Average Broker Recommendation | 1.38 (Strong Buy) |
Viad Corp (VVI) Company Bio
Viad Corporation provides experiential services in the exhibition and events, and travel and recreation industries in the United States, Canada, the United Kingdom, Germany, and the United Arab Emirates. It operates through three segments: Marketing & Events U.S., Marketing & Events International, and Travel & Recreation Group. The company was founded in 1914 and is based in Phoenix, Arizona.
Latest VVI News From Around the Web
Below are the latest news stories about VIAD CORP that investors may wish to consider to help them evaluate VVI as an investment opportunity.
3 Promising Small-Company Stocks to Buy for a Profitable Second HalfThese three under-the-radar small-company stock picks have big potential but also carry above-above average risk. |
Q1 2023 Viad Corp Earnings CallQ1 2023 Viad Corp Earnings Call |
Viad (VVI) Reports Q1 Loss, Tops Revenue EstimatesViad (VVI) delivered earnings and revenue surprises of 17.86% and 11.78%, respectively, for the quarter ended March 2023. Do the numbers hold clues to what lies ahead for the stock? |
Viad Corp Reports Results for the 2023 First QuarterSCOTTSDALE, Ariz., May 04, 2023--Viad Corp Reports Results for the 2023 First Quarter |
MoneyGram and Madison Dearborn Partners Announce Merger Transaction is Expected to Close on or before June 1, 2023MoneyGram International, Inc. (NASDAQ: MGI) ("MoneyGram" or the "Company"), a leading global financial technology company that connects the world's communities, today provided an update on its previously announced agreement (the "Merger Agreement") to be acquired by funds affiliated with Madison Dearborn Partners, LLC ("MDP"). |
VVI Price Returns
1-mo | 21.12% |
3-mo | 20.51% |
6-mo | -7.28% |
1-year | -18.18% |
3-year | -8.56% |
5-year | -51.17% |
YTD | 8.16% |
2022 | -43.00% |
2021 | 18.30% |
2020 | -46.24% |
2019 | 35.62% |
2018 | -8.91% |
Continue Researching VVI
Want to see what other sources are saying about Viad Corp's financials and stock price? Try the links below:Viad Corp (VVI) Stock Price | Nasdaq
Viad Corp (VVI) Stock Quote, History and News - Yahoo Finance
Viad Corp (VVI) Stock Price and Basic Information | MarketWatch
Loading social stream, please wait...