Wayfair Inc. Cl A (W): Price and Financial Metrics

Wayfair Inc. Cl A (W): $52.65

0.42 (-0.79%)

POWR Rating

Component Grades

Momentum

B

Stability

D

Sentiment

Quality

D

Industry: Specialty Retailers

Industry

D

Ranked

#37 of 44

in industry

W Price/Volume Stats
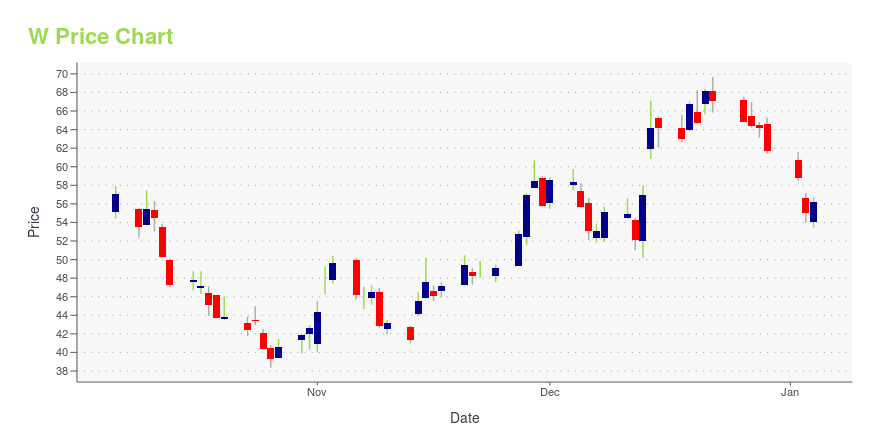
Current price $52.65 52-week high $90.71
Prev. close $53.07 52-week low $29.51
Day low $51.83 Volume 2,615,169
Day high $53.81 Avg. volume 5,026,522
50-day MA $49.61 Dividend yield N/A
200-day MA $51.52 Market Cap 6.21B

W Stock Price Chart Interactive Chart >

W POWR Grades

  • Growth is the dimension where W ranks best; there it ranks ahead of 95.39% of US stocks.
  • W's strongest trending metric is Growth; it's been moving up over the last 177 days.
  • W's current lowest rank is in the Stability metric (where it is better than 12.78% of US stocks).

W Stock Summary

  • The capital turnover (annual revenue relative to shareholder's equity) for W is -4.43 -- better than just 3.17% of US stocks.
  • Equity multiplier, or assets relative to shareholders' equity, comes in at -1.26 for WAYFAIR INC; that's greater than it is for merely 5.89% of US stocks.
  • The volatility of WAYFAIR INC's share price is greater than that of 84.59% US stocks with at least 200 days of trading history.
  • Stocks that are quantitatively similar to W, based on their financial statements, market capitalization, and price volatility, are EXLS, ENV, JHG, SDPI, and SND.
  • Visit W's SEC page to see the company's official filings. To visit the company's web site, go to www.wayfair.com.

W Valuation Summary

  • W's price/sales ratio is 0.6; this is 66.67% lower than that of the median Consumer Cyclical stock.
  • Over the past 112 months, W's price/sales ratio has gone down 2.2.

Below are key valuation metrics over time for W.

Stock Date P/S P/B P/E EV/EBIT
W 2023-12-01 0.6 -2.5 -7.5 -11.0
W 2023-11-30 0.5 -2.4 -7.2 -10.6
W 2023-11-29 0.6 -2.5 -7.5 -11.0
W 2023-11-28 0.6 -2.5 -7.3 -10.8
W 2023-11-27 0.5 -2.3 -6.8 -10.2
W 2023-11-24 0.5 -2.1 -6.3 -9.7

W Growth Metrics

    The 2 year net income to common stockholders growth rate now stands at 56.24%.
  • The 5 year net cashflow from operations growth rate now stands at -647.35%.
  • Its 2 year cash and equivalents growth rate is now at 92.16%.
W's revenue has moved up $3,241,716,000 over the prior 33 months.

The table below shows W's growth in key financial areas (numbers in millions of US dollars).

Date Revenue Operating Cash Flow Net Income to Common Stock
2022-09-30 12,368.77 -683.187 -1,181.641
2022-06-30 12,649.86 -383.035 -976.662
2022-03-31 13,223.48 7.404 -468.234
2021-12-31 13,708 410 -131
2021-09-30 14,127.08 527.93 94.459
2021-06-30 14,845.57 989.805 345.646

W's Quality Factors

The “Quality” component of the POWR Ratings focuses on 31 different factors of a companies fundamentals and operational strength. Here are some key insights as we drill into the specifics of these quality attributes.
  • W has a Quality Grade of C, ranking ahead of 73.6% of graded US stocks.
  • W's asset turnover comes in at 3.195 -- ranking 9th of 165 Retail stocks.
  • NSIT, DG, and URBN are the stocks whose asset turnover ratios are most correlated with W.

The table below shows W's key quality metrics over time.

Period Asset Turnover Gross Margin ROIC
2021-06-30 3.195 0.293 0.118
2021-03-31 3.346 0.297 0.174
2020-12-31 3.480 0.291 0.107
2020-09-30 3.553 0.279 -0.019
2020-06-30 3.506 0.263 -0.186
2020-03-31 3.493 0.237 -0.393

W Price Target

For more insight on analysts targets of W, see our W price target page. And for a list of of all stocks sorted by upside potential based on analyst target price, see our Top Price Target page.

Average Price Target $330.70 Average Broker Recommendation 1.76 (Moderate Buy)

Wayfair Inc. Cl A (W) Company Bio


Wayfair Inc. is an American e-commerce company based in Boston, Massachusetts that sells furniture and home goods online. Formerly known as CSN Stores, it was founded in 2002, and currently offers 14 million items from more than 11,000 global suppliers. It has offices and warehouses throughout the United States and in CanadaGermanyIreland and the United Kingdom. (Source:Wikipedia)


W Latest News Stream


Event/Time News Detail
Loading, please wait...

W Latest Social Stream


Loading social stream, please wait...

View Full W Social Stream

Latest W News From Around the Web

Below are the latest news stories about WAYFAIR INC that investors may wish to consider to help them evaluate W as an investment opportunity.

3 Unstoppable Stocks to Buy Right Now Before They Skyrocket

The market volatility over the last few years has left many familiar brands trading at low share prices. Let's see why three Motley Fool contributors believe these stocks are timely buys. Initial public offering (IPO) stocks often take off quickly, especially if there's hype, and it's a fast-growing company.

Yahoo | December 2, 2023

Wayfair (W) Up 19.5% Since Last Earnings Report: Can It Continue?

Wayfair (W) reported earnings 30 days ago. What's next for the stock? We take a look at earnings estimates for some clues.

Yahoo | December 1, 2023

E-Commerce to Boost Holiday Season Retail Sales: 5 Winners

Amazon.com, Inc. (AMZN), Travelzoo (TZOO), Wayfair Inc. (W), Tripadvisor, Inc. (TRIP) and Target Corporation (TGT) are benefiting from the dominance of e-commerce.

Yahoo | November 28, 2023

The Zacks Analyst Blog Highlights Amazon.com, Booking Holdings, Wayfair, Tripadvisor and Rover Group

Amazon.com, Booking Holdings, Wayfair, Tripadvisor and Rover Group are included in this Analyst Blog.

Yahoo | November 28, 2023

Wayfair Stock Got Just What You Need With RS Rating Jump To 86

When looking for the best stocks to buy and watch, focus on those with rising relative price strength. One stock that fits that bill is Wayfair stock, which had its Relative Strength (RS) Rating upgraded from 76 to 86 Monday. The online home furnishings retailer stands to get a boost from big holiday sales on Black Friday and Cyber Monday.

Yahoo | November 27, 2023

Read More 'W' Stories Here

W Price Returns

1-mo 13.67%
3-mo -26.00%
6-mo 1.06%
1-year 47.85%
3-year -77.76%
5-year -49.75%
YTD 60.08%
2022 -82.69%
2021 -15.87%
2020 149.87%
2019 0.32%
2018 12.22%

Continue Researching W

Want to see what other sources are saying about Wayfair Inc's financials and stock price? Try the links below:

Wayfair Inc (W) Stock Price | Nasdaq
Wayfair Inc (W) Stock Quote, History and News - Yahoo Finance
Wayfair Inc (W) Stock Price and Basic Information | MarketWatch

Get Free Updates

Join thousands of investors who get the latest news, insights and top rated picks from StockNews.com!