
Wilhelmina International, Inc. (WHLM): Price and Financial Metrics
WHLM Price/Volume Stats
| Current price | $5.40 | 52-week high | $7.62 |
| Prev. close | $5.69 | 52-week low | $3.40 |
| Day low | $5.40 | Volume | 1,120 |
| Day high | $5.87 | Avg. volume | 12,385 |
| 50-day MA | $5.46 | Dividend yield | N/A |
| 200-day MA | $4.68 | Market Cap | 27.85M |
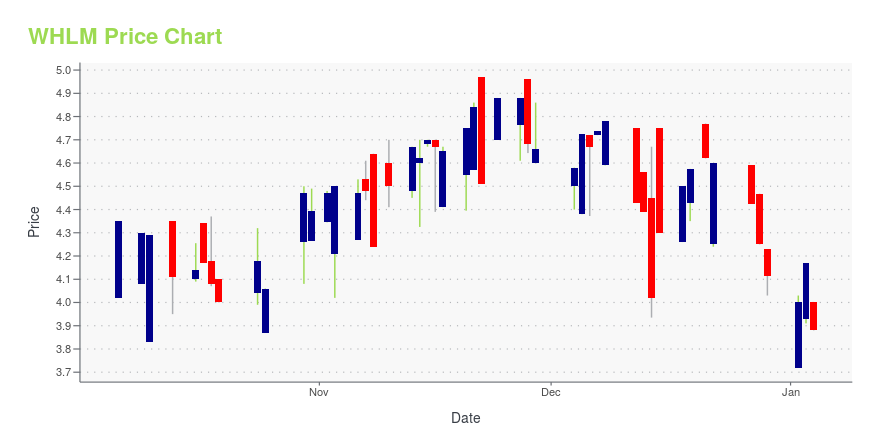
WHLM Stock Price Chart Interactive Chart >
Wilhelmina International, Inc. (WHLM) Company Bio
Wilhelmina International, Inc. primarily engages in the fashion model management business. It specializes in the representation and management of models, entertainers, artists, athletes, and other talent to various clients, including retailers, designers, advertising agencies, print and electronic media and catalog companies. The company offers fashion modeling talent and social media influencer services to clients, such as advertising agencies, branded consumer goods companies, fashion designers, Internet sites, retailers, department stores, product catalogs, and magazine publications; and represents artists in the hair, makeup, photography, and stylist arenas to various companies in the media, advertising, retail, pharmaceutical, and music industries. It is also involved in the licensing of the Wilhelmina name to third-parties, such as fashion model agencies; television syndication royalties and production series contracts; and celebrity management activities. The company has operations in Los Angeles, Miami, Chicago, and London, as well as a network of licensees in various local markets in the United States and internationally. Wilhelmina International, Inc. was founded in 1967 and is headquartered in Dallas, Texas.
Latest WHLM News From Around the Web
Below are the latest news stories about WILHELMINA INTERNATIONAL INC that investors may wish to consider to help them evaluate WHLM as an investment opportunity.
Wilhelmina International, Inc. Reports Results for Third Quarter 2023Third Quarter Financial Results (in thousands)Q3 23Q3 22YOYChange Q3 23 YTDQ3 22 YTDYOYChange Total Revenues$4,472$4,4420.7%$13,449$13,689(1.8%)Operating Income 467671(30.4%)8452,585(67.3%)Income Before Provision for Taxes485776(37.5%)7832,789(71.9%)Net Income 3591,887(81.0%)5043,547(85.8%)Gross Billings*16,15816,264(0.7%)51,28650,5131.5%EBITDA* 540820(34.1%)9462,944(67.9%)Adjusted EBITDA*547768(28.8%1,0812,898(62.7%)Pre-Corporate EBITDA*7951,015(21.7%)1,8193,621(49.8%)*Non-GAAP measures referen |
Wilhelmina International (NASDAQ:WHLM) Is Looking To Continue Growing Its Returns On CapitalIf you're not sure where to start when looking for the next multi-bagger, there are a few key trends you should keep an... |
Do Its Financials Have Any Role To Play In Driving Wilhelmina International, Inc.'s (NASDAQ:WHLM) Stock Up Recently?Most readers would already be aware that Wilhelmina International's (NASDAQ:WHLM) stock increased significantly by 11... |
Wilhelmina International, Inc. Reports Results for Second Quarter 2023Second Quarter Financial Results (in thousands)Q2 23Q2 22YOYChangeQ2 23 YTDQ2 22 YTDYOYChangeTotal Revenues$4,493 $4,699(4.4%)$8,977$9,247(2.9%)Operating Income 149 1,040(85.7%) 378 1,914(80.3%)Income Before Provision for Taxes 88 1,148(92.3%) 298 2,013(85.2%)Net (Loss) Income (14) 921(101.5%) 145 1,660(91.3%)Gross Billings* 17,541 17,604(0.4%) 35,128 34,2492.6%EBITDA* 144 1,197(88.0%) 406 2,124(80.9%)Adjusted EBITDA* 230 1,142(79.9%) 534 2,130(74.9%)Pre-Corporate EBITDA* 476 1,364(65.1%) 1.024 |
Wilhelmina International First Quarter 2023 Earnings: EPS: US$0.031 (vs US$0.14 in 1Q 2022)Wilhelmina International ( NASDAQ:WHLM ) First Quarter 2023 Results Key Financial Results Revenue: US$4.48m (down 73... |
WHLM Price Returns
| 1-mo | -0.18% |
| 3-mo | 3.87% |
| 6-mo | 17.52% |
| 1-year | 53.41% |
| 3-year | 22.17% |
| 5-year | -6.09% |
| YTD | 31.23% |
| 2023 | 16.24% |
| 2022 | -32.57% |
| 2021 | 14.38% |
| 2020 | 10.87% |
| 2019 | -28.99% |
Continue Researching WHLM
Want to see what other sources are saying about Wilhelmina International Inc's financials and stock price? Try the links below:Wilhelmina International Inc (WHLM) Stock Price | Nasdaq
Wilhelmina International Inc (WHLM) Stock Quote, History and News - Yahoo Finance
Wilhelmina International Inc (WHLM) Stock Price and Basic Information | MarketWatch
Loading social stream, please wait...