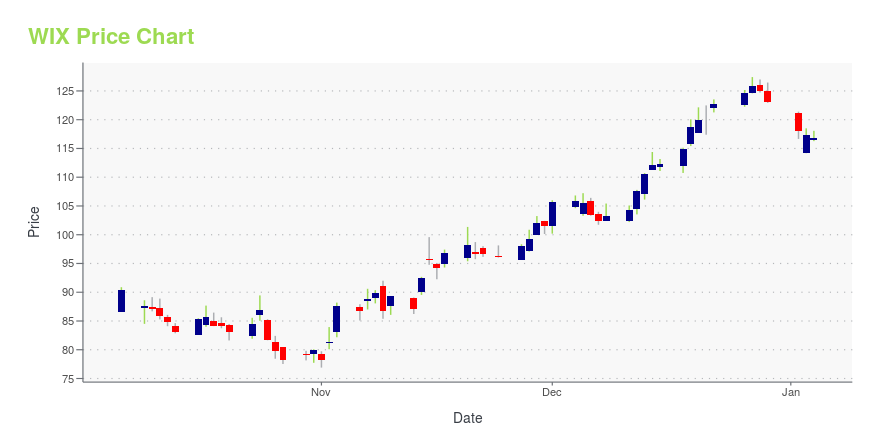
Wix.com Ltd. (WIX): Price and Financial Metrics
WIX Price/Volume Stats
Current price | $76.54 | 52-week high | $101.55 |
Prev. close | $76.00 | 52-week low | $53.12 |
Day low | $76.04 | Volume | 632,300 |
Day high | $77.62 | Avg. volume | 796,693 |
50-day MA | $85.59 | Dividend yield | N/A |
200-day MA | $82.12 | Market Cap | 4.35B |
WIX Stock Price Chart Interactive Chart >
WIX POWR Grades
- Growth is the dimension where WIX ranks best; there it ranks ahead of 89.9% of US stocks.
- WIX's strongest trending metric is Growth; it's been moving up over the last 179 days.
- WIX's current lowest rank is in the Momentum metric (where it is better than 12.6% of US stocks).
WIX Stock Summary
- The capital turnover (annual revenue relative to shareholder's equity) for WIX is -6.55 -- better than just 2.47% of US stocks.
- Price to trailing twelve month operating cash flow for WIX is currently 45.62, higher than 91.38% of US stocks with positive operating cash flow.
- Equity multiplier, or assets relative to shareholders' equity, comes in at -11.81 for WIXCOM LTD; that's greater than it is for merely 1.91% of US stocks.
- Stocks with similar financial metrics, market capitalization, and price volatility to WIXCOM LTD are ALGM, CHRS, RFL, PINS, and IVAC.
- Visit WIX's SEC page to see the company's official filings. To visit the company's web site, go to www.wix.com.
WIX Valuation Summary
- In comparison to the median Technology stock, WIX's price/earnings ratio is 142.35% lower, now standing at -10.8.
- Over the past 116 months, WIX's price/sales ratio has gone down 5.3.
Below are key valuation metrics over time for WIX.
Stock | Date | P/S | P/B | P/E | EV/EBIT |
---|---|---|---|---|---|
WIX | 2023-05-16 | 3.3 | -17.4 | -10.8 | -19.2 |
WIX | 2023-05-15 | 3.2 | -16.7 | -10.4 | -18.6 |
WIX | 2023-05-12 | 3.1 | -16.3 | -10.1 | -18.2 |
WIX | 2023-05-11 | 3.2 | -16.6 | -10.3 | -18.5 |
WIX | 2023-05-10 | 3.1 | -16.6 | -10.3 | -18.5 |
WIX | 2023-05-09 | 3.0 | -15.9 | -9.8 | -17.8 |
WIX Growth Metrics
- Its year over year cash and equivalents growth rate is now at -5.69%.
- Its 4 year net cashflow from operations growth rate is now at 175.53%.
- Its 5 year price growth rate is now at 144.79%.

The table below shows WIX's growth in key financial areas (numbers in millions of US dollars).
Date | Revenue | Operating Cash Flow | Net Income to Common Stock |
---|---|---|---|
2022-09-30 | 1,360.968 | 21.308 | -496.907 |
2022-06-30 | 1,335.96 | 9.015 | -432.879 |
2022-03-31 | 1,307.142 | 33.535 | -283.684 |
2021-12-31 | 1,269.657 | 65.685 | -117.209 |
2021-12-31 | 1,269.657 | 65.685 | -117.209 |
2021-09-30 | 1,223.849 | 73.194 | -78.551 |
WIX's Quality Factors
The “Quality” component of the POWR Ratings focuses on 31 different factors of a companies fundamentals and operational strength. Here are some key insights as we drill into the specifics of these quality attributes.- WIX has a Quality Grade of C, ranking ahead of 69% of graded US stocks.
- WIX's asset turnover comes in at 0.599 -- ranking 270th of 561 Business Services stocks.
- ASGN, MSFT, and AER are the stocks whose asset turnover ratios are most correlated with WIX.
The table below shows WIX's key quality metrics over time.
Period | Asset Turnover | Gross Margin | ROIC |
---|---|---|---|
2021-06-30 | 0.599 | 0.637 | -0.138 |
2021-03-31 | 0.629 | 0.657 | -0.149 |
2020-12-31 | 0.656 | 0.681 | -0.140 |
2020-12-31 | 0.656 | 0.681 | -0.140 |
2020-09-30 | 0.687 | 0.704 | -0.142 |
2020-06-30 | 0.752 | 0.715 | -0.159 |
WIX Price Target
For more insight on analysts targets of WIX, see our WIX price target page. And for a list of of all stocks sorted by upside potential based on analyst target price, see our Top Price Target page.
Average Price Target | $266.78 | Average Broker Recommendation | 1.43 (Moderate Buy) |
Wix.com Ltd. (WIX) Company Bio
Wix.com Ltd. (Hebrew: וויקס.קום) is an Israeli software company, publicly listed in the US, that provides cloud-based web development services. It allows users to create HTML5 websites and mobile sites through the use of online drag and drop tools. Along with its headquarters and other offices in Israel, Wix also has offices in Brazil, Canada, Germany, India, Ireland, Japan, Lithuania, Poland, the Netherlands, the United States, Ukraine, and Singapore. (Source:Wikipedia)
Latest WIX News From Around the Web
Below are the latest news stories about WIXCOM LTD that investors may wish to consider to help them evaluate WIX as an investment opportunity.
Is It Too Late To Consider Buying Wix.com Ltd. (NASDAQ:WIX)?Wix.com Ltd. ( NASDAQ:WIX ), might not be a large cap stock, but it saw a decent share price growth in the teens level... |
Wix to Participate in Fireside Chat at the Jefferies Software ConferenceWix.com Ltd. (Nasdaq: WIX), today announced that Nir Zohar, COO & President, and Lior Shemesh, CFO, will participate in a fireside chat at the Jefferies Software Conference on Wednesday, May 31, 2023 at 8 AM PDT. |
Wix.com Ltd. (NASDAQ:WIX) Q1 2023 Earnings Call TranscriptWix.com Ltd. (NASDAQ:WIX) Q1 2023 Earnings Call Transcript May 17, 2023 Wix.com Ltd. misses on earnings expectations. Reported EPS is $-1.61 EPS, expectations were $0.14. Operator: Good day and thank you for standing by. Welcome to the Wix Q1 2023 Earnings Conference Call. At this time, all participants are in a listen-only mode. After the […] |
Wix.com (WIX) Q1 2023 Earnings Call TranscriptJoining me today to discuss the results are Avishai Abrahami, CEO and co-founder; Nir Zohar, our president and COO; and Lior Shemesh, our CFO. During this call, we may make forward-looking statements, and these statements are based on current expectations and assumptions. |
Why Wix.com Stock Was Down Earlier WednesdayWix.Com (NASDAQ: WIX) reported better-than-expected first-quarter earnings results before the market opened Wednesday. The stock was quite volatile, jumping by as much as 8% in pre-market trading before falling sharply to a decline of 4% in the first half-hour of the session. A lot of new customers used Wix's services to create websites in the early phases of the pandemic, which sent the stock soaring, but it's been downhill since then. |
WIX Price Returns
1-mo | 1.61% |
3-mo | -18.54% |
6-mo | -10.55% |
1-year | 29.42% |
3-year | -66.40% |
5-year | -16.40% |
YTD | -0.38% |
2022 | -51.31% |
2021 | -36.87% |
2020 | 104.25% |
2019 | 35.47% |
2018 | 56.98% |
Continue Researching WIX
Want to do more research on Wixcom Ltd's stock and its price? Try the links below:Wixcom Ltd (WIX) Stock Price | Nasdaq
Wixcom Ltd (WIX) Stock Quote, History and News - Yahoo Finance
Wixcom Ltd (WIX) Stock Price and Basic Information | MarketWatch
Loading social stream, please wait...