
Willdan Group, Inc. (WLDN): Price and Financial Metrics
WLDN Price/Volume Stats
| Current price | $33.78 | 52-week high | $34.81 |
| Prev. close | $33.82 | 52-week low | $17.09 |
| Day low | $33.29 | Volume | 42,714 |
| Day high | $34.75 | Avg. volume | 62,927 |
| 50-day MA | $31.14 | Dividend yield | N/A |
| 200-day MA | $24.73 | Market Cap | 466.74M |
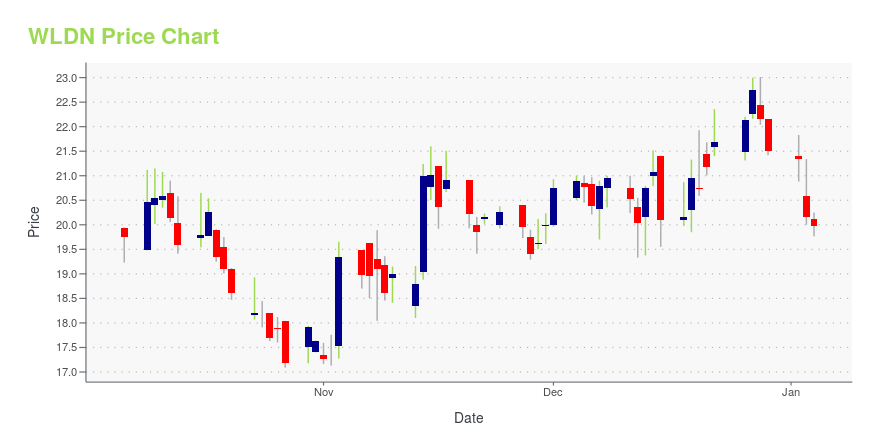
WLDN Stock Price Chart Interactive Chart >
Willdan Group, Inc. (WLDN) Company Bio
Willdan Group, Inc. provides professional technical and consulting services to utilities, private industry, and public agencies at various levels of government primarily in the Unites States. It operates through four segments: Energy Efficiency Services, Engineering Services, Public Finance Services, and Homeland Security Services. The company was founded in 1964 and is based in Anaheim, California.
Latest WLDN News From Around the Web
Below are the latest news stories about WILLDAN GROUP INC that investors may wish to consider to help them evaluate WLDN as an investment opportunity.
Despite Fast-paced Momentum, Willdan (WLDN) Is Still a Bargain StockIf you are looking for stocks that have gained strong momentum recently but are still trading at reasonable prices, Willdan (WLDN) could be a great choice. It is one of the several stocks that passed through our 'Fast-Paced Momentum at a Bargain' screen. |
Should Value Investors Buy Willdan Group (WLDN) Stock?Here at Zacks, our focus is on the proven Zacks Rank system, which emphasizes earnings estimates and estimate revisions to find great stocks. Nevertheless, we are always paying attention to the latest value, growth, and momentum trends to underscore strong picks. |
Willdan Group, Inc. (NASDAQ:WLDN) is favoured by institutional owners who hold 64% of the companyKey Insights Given the large stake in the stock by institutions, Willdan Group's stock price might be vulnerable to... |
Willdan Selected to Help Decarbonize a National Health Care Provider’s PortfolioANAHEIM, Calif., December 14, 2023--Willdan Group, Inc. (NASDAQ: WLDN) announced today that a national health care provider has selected Willdan to help implement strategies to reach their 2050 decarbonization goals for more than 1,000 buildings. This initiative targets reductions in natural gas usage in domestic hot water, HVAC, sterilization systems, and central utility plants in hospitals and medical office buildings. By making use of available federal, state, and local incentives, Willdan wi |
Willdan Announces CEO SuccessionANAHEIM, Calif., December 12, 2023--Willdan Group, Inc. (NASDAQ: WLDN) today announced that on December 8, 2023, Tom Brisbin, Willdan’s CEO, notified the Board of Directors (the "Board") of his intention to retire from his position as CEO of the company effective December 29, 2023. Tom will retain his role as Chairman of the Board and will act as the company’s part-time consultant to ensure a smooth transition after December 29, 2023. Willdan’s President, Mike Bieber, will succeed Tom as CEO and |
WLDN Price Returns
| 1-mo | 21.25% |
| 3-mo | 19.36% |
| 6-mo | 71.47% |
| 1-year | 75.94% |
| 3-year | -13.30% |
| 5-year | -3.98% |
| YTD | 57.12% |
| 2023 | 20.45% |
| 2022 | -49.29% |
| 2021 | -15.59% |
| 2020 | 31.21% |
| 2019 | -9.15% |
Continue Researching WLDN
Here are a few links from around the web to help you further your research on Willdan Group Inc's stock as an investment opportunity:Willdan Group Inc (WLDN) Stock Price | Nasdaq
Willdan Group Inc (WLDN) Stock Quote, History and News - Yahoo Finance
Willdan Group Inc (WLDN) Stock Price and Basic Information | MarketWatch
Loading social stream, please wait...