Wheaton Precious Metals Corp (WPM): Price and Financial Metrics
WPM Price/Volume Stats
Current price | $40.55 | 52-week high | $52.76 |
Prev. close | $40.47 | 52-week low | $29.76 |
Day low | $40.28 | Volume | 1,771,200 |
Day high | $41.74 | Avg. volume | 2,002,535 |
50-day MA | $43.03 | Dividend yield | 1.49% |
200-day MA | $44.44 | Market Cap | 18.37B |
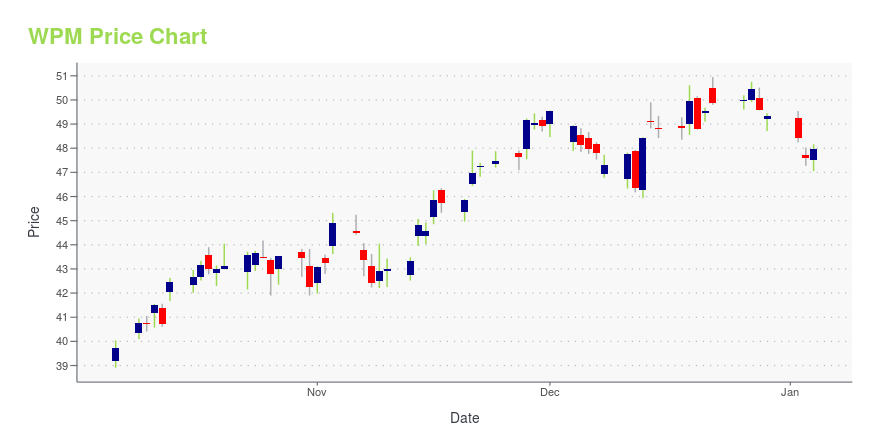
WPM Stock Price Chart Interactive Chart >
WPM POWR Grades
- WPM scores best on the Quality dimension, with a Quality rank ahead of 87.96% of US stocks.
- WPM's strongest trending metric is Quality; it's been moving up over the last 178 days.
- WPM's current lowest rank is in the Sentiment metric (where it is better than 10.02% of US stocks).
WPM Stock Summary
- Of note is the ratio of WHEATON PRECIOUS METALS CORP's sales and general administrative expense to its total operating expenses; merely 0.22% of US stocks have a lower such ratio.
- The ratio of debt to operating expenses for WHEATON PRECIOUS METALS CORP is higher than it is for about just 0.31% of US stocks.
- With a price/sales ratio of 19.73, WHEATON PRECIOUS METALS CORP has a higher such ratio than 93.98% of stocks in our set.
- Stocks with similar financial metrics, market capitalization, and price volatility to WHEATON PRECIOUS METALS CORP are QIPT, HPK, FAF, NOMD, and CPK.
- Visit WPM's SEC page to see the company's official filings. To visit the company's web site, go to www.wheatonpm.com.
WPM Valuation Summary
- WPM's price/sales ratio is 19.7; this is 936.84% higher than that of the median Basic Materials stock.
- WPM's price/sales ratio has moved NA NA over the prior 220 months.
Below are key valuation metrics over time for WPM.
Stock | Date | P/S | P/B | P/E | EV/EBIT |
---|---|---|---|---|---|
WPM | 2023-08-02 | 19.7 | 2.8 | 30.7 | 29.5 |
WPM | 2023-08-01 | 20.4 | 2.9 | 31.8 | 30.6 |
WPM | 2023-07-31 | 20.9 | 3.0 | 32.5 | 31.3 |
WPM | 2023-07-28 | 20.5 | 2.9 | 32.0 | 30.7 |
WPM | 2023-07-27 | 20.4 | 2.9 | 31.8 | 30.6 |
WPM | 2023-07-26 | 20.9 | 3.0 | 32.7 | 31.5 |
WPM Growth Metrics
- Its 4 year cash and equivalents growth rate is now at 10.39%.
- The 2 year cash and equivalents growth rate now stands at 196.95%.
- Its year over year price growth rate is now at 1.26%.

The table below shows WPM's growth in key financial areas (numbers in millions of US dollars).
Date | Revenue | Operating Cash Flow | Net Income to Common Stock |
---|---|---|---|
2022-09-30 | 1,107.199 | 766.685 | 794.823 |
2022-06-30 | 1,157.32 | 813.475 | 733.3 |
2022-03-31 | 1,184.791 | 823.531 | 750.35 |
2021-12-31 | 1,201.665 | 845.145 | 754.885 |
2021-12-31 | 1,201.665 | 845.145 | 754.885 |
2021-09-30 | 1,209.681 | 857.818 | 620.284 |
WPM's Quality Factors
The “Quality” component of the POWR Ratings focuses on 31 different factors of a companies fundamentals and operational strength. Here are some key insights as we drill into the specifics of these quality attributes.- WPM has a Quality Grade of A, ranking ahead of 95.98% of graded US stocks.
- WPM's asset turnover comes in at 0.179 -- ranking 28th of 47 Precious Metals stocks.
- 500 - Internal server error
The table below shows WPM's key quality metrics over time.
Period | Asset Turnover | Gross Margin | ROIC |
---|---|---|---|
2020-12-31 | 0.179 | 0.534 | 0.081 |
2019-12-31 | 0.135 | 0.402 | 0.017 |
2018-12-31 | 0.131 | 0.373 | 0.069 |
2017-12-31 | 0.142 | 0.400 | 0.012 |
2016-12-31 | 0.151 | 0.368 | 0.031 |
2015-12-31 | 0.126 | 0.401 | -0.026 |
WPM Price Target
For more insight on analysts targets of WPM, see our WPM price target page. And for a list of of all stocks sorted by upside potential based on analyst target price, see our Top Price Target page.
Average Price Target | $59.61 | Average Broker Recommendation | 1.41 (Moderate Buy) |
Wheaton Precious Metals Corp (WPM) Company Bio
Wheaton Precious Metals Corp. is a Canadian multinational precious metals streaming company. It produces over 26 million ounces and sells over 29 million ounces of silver mined by other companies (including Barrick Gold and Goldcorp) as a by-product of their main operations. (Source:Wikipedia)
Latest WPM News From Around the Web
Below are the latest news stories about WHEATON PRECIOUS METALS CORP that investors may wish to consider to help them evaluate WPM as an investment opportunity.
3 Gold Mining Stocks to Bet On as Market Fears GrowAs uncertainties rattle global economies, gold mining stocks are emerging as a beacon for investors seeking both security and growth. |
Wheaton Precious Metals Corp. (WPM) Gold Forum Americas Conference (Transcript)Wheaton Precious Metals Corp. (WPM) Gold Forum Americas Conference September 19, 2023, 02:30 PM ET Company Participants Randy Smallwood - President and Chief Executive Officer Conference Call Participants Cosmos Chiu - CIBC World Markets Presentation Cosmos Chiu Great. Next up, we have Randy Smallwood, President and CEO of Wheaton Precious Metals. I was flipping through the pages, trying to find Randy's biography. I'm not sure why. We all know Randy. And I know Randy. So, Randy. Randy Smallwood Thank you, Cosmos. And thank you, everyone, for joining us. I guess I've got enough silver hair that you all know who I am. I've been around lo... |
With 72% ownership, Wheaton Precious Metals Corp. (TSE:WPM) boasts of strong institutional backingKey Insights Given the large stake in the stock by institutions, Wheaton Precious Metals' stock price might be... |
10 Best Silver ETFsIn this article, we discuss the 10 best silver ETFs. If you want to skip our discussion on the silver industry, you can go directly to the 5 Best Silver ETFs. According to Research and Markets, the demand for silver globally is expected to compound at an average annual rate of nearly 3% to reach […] |
7 Reasons Investors Should Be Excited About Wheaton Precious Metals' Business ModelWheaton Precious Metals is a unique way to invest in gold and silver, and there are many reasons why it's worth a deep dive. |
WPM Price Returns
1-mo | -6.11% |
3-mo | -7.43% |
6-mo | -18.40% |
1-year | 27.07% |
3-year | -16.28% |
5-year | 150.10% |
YTD | 4.79% |
2022 | -7.53% |
2021 | 3.56% |
2020 | 41.82% |
2019 | 54.62% |
2018 | -10.04% |
WPM Dividends
Ex-Dividend Date | Type | Payout Amount | Change | ||||||
---|---|---|---|---|---|---|---|---|---|
Loading, please wait... |
Continue Researching WPM
Want to see what other sources are saying about Wheaton Precious Metals Corp's financials and stock price? Try the links below:Wheaton Precious Metals Corp (WPM) Stock Price | Nasdaq
Wheaton Precious Metals Corp (WPM) Stock Quote, History and News - Yahoo Finance
Wheaton Precious Metals Corp (WPM) Stock Price and Basic Information | MarketWatch
Loading social stream, please wait...