
Willis Towers Watson PLC (WTW): Price and Financial Metrics
WTW Price/Volume Stats
| Current price | $283.09 | 52-week high | $283.49 |
| Prev. close | $277.60 | 52-week low | $195.29 |
| Day low | $278.50 | Volume | 713,800 |
| Day high | $283.49 | Avg. volume | 453,441 |
| 50-day MA | $259.64 | Dividend yield | 1.32% |
| 200-day MA | $253.29 | Market Cap | 28.94B |
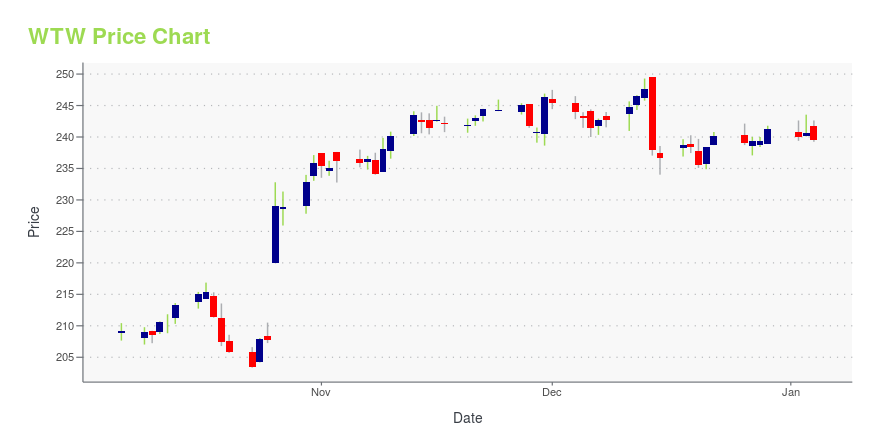
WTW Stock Price Chart Interactive Chart >
Willis Towers Watson PLC (WTW) Company Bio
Willis Towers Watson Public Limited Company is a British-American multinational risk management, insurance brokerage and advisory company. The firm has roots dating from 1828 and is the third largest insurance broker in the world. (Source:Wikipedia)
Latest WTW News From Around the Web
Below are the latest news stories about WILLIS TOWERS WATSON PLC that investors may wish to consider to help them evaluate WTW as an investment opportunity.
Willis Towers Watson PLC's Dividend AnalysisWillis Towers Watson PLC (NASDAQ:WTW) recently announced a dividend of $0.84 per share, payable on 2024-01-16, with the ex-dividend date set for 2023-12-28. As investors look forward to this upcoming payment, the spotlight also shines on the company's dividend history, yield, and growth rates. Using the data from GuruFocus, let's look into Willis Towers Watson PLC's dividend performance and assess its sustainability. |
Why You Might Be Interested In Willis Towers Watson Public Limited Company (NASDAQ:WTW) For Its Upcoming DividendWillis Towers Watson Public Limited Company ( NASDAQ:WTW ) stock is about to trade ex-dividend in four days. The... |
WTW set to acquire AIMUW in major boost to risk advisory and broking presence in ItalyMILAN, Italy, Dec. 14, 2023 (GLOBE NEWSWIRE) -- WTW (NASDAQ: WTW), a leading global advisory, broking, and solutions company, has signed a definitive agreement to acquire AIMUW, a specialist Managing General Agent (MGA) in Italy. The deal reflects WTW’s global strategy to invest in high-performing businesses and to explore the growing connection between risk and capital. It also underlines WTW’s commitment to the Italian market and its ambition to enhance its wholesale business there.AIMUW has a |
WTW launches CyProtect Bermuda, reinventing distinction in Cyber InsuranceHAMILTON, Bermuda, Dec. 12, 2023 (GLOBE NEWSWIRE) -- WTW (Nasdaq: WTW), a leading global advisory, broking, and solutions company, today announced the launch of CyProtect Bermuda, a cutting-edge cyber insurance product designed and tailored to be a comprehensive solution for financial, professional, and executive risks. Targeted towards large enterprises operating in the Bermuda market, CyProtect Bermuda is setting a new standard, delivering fortified coverage, streamlined processes, and exclusi |
U.S. commercial insurance rates continue to demonstrate aggregate increase above 6%Commercial Lines Insurance Pricing Survey 2023 Q3NEW YORK, Dec. 11, 2023 (GLOBE NEWSWIRE) -- WTW (Nasdaq: WTW), a leading global advisory, broking, and solutions company, today announced that U.S. commercial insurance prices have sustained an upward trajectory throughout the third quarter of 2023. According to the latest findings from WTW's Commercial Lines Insurance Pricing Survey (CLIPS), prepared by the Insurance Consulting and Technology (ICT) business, commercial premiums have demonstrated |
WTW Price Returns
| 1-mo | 7.73% |
| 3-mo | 13.18% |
| 6-mo | 14.22% |
| 1-year | 35.26% |
| 3-year | 43.47% |
| 5-year | 52.38% |
| YTD | 18.14% |
| 2023 | 0.08% |
| 2022 | 4.53% |
| 2021 | 14.16% |
| 2020 | 5.83% |
| 2019 | 34.81% |
WTW Dividends
| Ex-Dividend Date | Type | Payout Amount | Change | ||||||
|---|---|---|---|---|---|---|---|---|---|
| Loading, please wait... | |||||||||
Loading social stream, please wait...